Thursday, July 28, 2022

DARPA's new gambit missile to exploit Rotating Detonation Engine

DARPA's new missile hints at truly game-changing technology - Sandboxx

sandboxx.us

DARPA's new missile hints at truly game-changing technology

Alex Hollings

Last week, the Defense Advanced Research Projects Agency (DARPA) quietly unveiled a new high-speed missile program called Gambit. The program is meant to leverage a novel method of propulsion that could have far-reaching implications not just in terms of weapons development, but for high-speed aircraft and even in how the Navy’s warships are powered. 

executivegov.com

DARPA Sets Proposers Day for Rotating Detonation Engine Project

by Kacey Roberts

The Defense Advanced Research Projects Agency will host an industry event on Aug. 16 in Arlington, Virginia, to discuss a forthcoming program that centers around propulsion technology envisioned to power a long-range air-to-ground strike weapon system.

DARPA expects the two-phase Gambit project to last 36 months with the goal of developing and demonstrating a rotating detonation engine, according to a notice posted Monday on SAM.gov.

The first phase will cover preliminary RDE design work and direct-connect combustor and freejet inlet tests, followed by detailed system design and tip-to-tail testing in simulated flight environments.

Efforts under the program seek to pave the way for a flight test of a high-supersonic weapon prototype, DARPA noted.

Interested business representatives should register in advance to attend the proposers’ day as the agency will fill accept registrations on a first-come, first-served basis.


This propulsion system, known as a rotation detonation engine (RDE), has the potential to be lighter than existing jet engines while offering a significant boost in power output, range, and fuel efficiency.

The Gambit missile is just one of a number of programs placing a renewed focus on RDE technology, though for the most part, these systems have managed to fly under the media’s radar. That is, except for Aviation Week & Space Technology Defense Editor Steve Trimble, who has covered these recent developments at length. Trimble was kind enough to discuss that work with me as I sought to better understand just how big a deal this technology could be.

Rotation Detonation Engines may not be common in discussion today, but amid the ongoing hypersonic arms race and America’s renewed focus on deterring near-peers, this technology could help offset a number of tactical and strategic advantages presented by America’s opponents in places like Europe and the Pacific…

…And it may be closer than you think.

Related: Is America really losing the hypersonic arms race? 

A new kind of propulsion system

rotation detonation engine
Aerojet Rocketdyne rotation detonation engine under testing.

Rotating detonation engines have been the subject of theory and speculation for decades, but have yet to cross the barrier between theory and practical application.

In theory, a rotating detonation engine promises to be much more efficient than traditional jet engines, potentially providing missile applications a serious boost in range and speed. That could also mean fielding smaller weapons capable of achieving the same speeds and ranges as today’s missiles.

In aircraft applications like jet fighters, rotation detonation engines could offer similar benefits to missiles in terms of range and speed, while potentially reducing maintenance requirements. Fighters, in particular, rely on afterburners, which effectively firehose fuel into the engine’s exhaust stream for added thrust, which, you can imagine, rapidly depletes fuel stores and reduces the fighter’s range. RDEs could potentially allow for a similar boost in thrust with a dramatically reduced fuel penalty.

But where this technology could be the most useful is in powering the Navy’s future non-nuclear surface vessels, providing increased power production, range, and speed while having a seriously beneficial impact on the Navy’s budgetary bottom line.

Related: The Air Force is eyeing groundbreaking new engines for the F-35

Harnessing the power of detonation

The concept behind rotation detonation engines dates back to the 1950s. In the United States, Arthur Nicholls, a professor emeritus of aerospace engineering at the University of Michigan, was among the first to attempt to develop a working RDE design.

In some ways, a Rotating Detonation Engine is an extension of the concept behind pulse detonation engines (PDEs), which are, in themselves, an extension of pulsejets. That might seem confusing (and maybe it is), but we’ll break it down.

Pulsejet engines work by mixing air and fuel within a combustion chamber and then igniting the mixture to fire out of a nozzle in rapid pulses, rather than under consistent combustion like you might find in other jet engines.

In pulsejet engines, as in nearly all combustion engines, igniting and burning the air/fuel mixture is called deflagration, which basically means heating a substance until it burns away rapidly, but at subsonic speeds.

detonation engine

A pulse detonation engine works similarly, but instead of leveraging deflagration, it uses detonation. At a fundamental level, detonation is a lot like it sounds: an explosion.

While deflagration speaks to the ignition and subsonic burning of the air/fuel mixture, detonation is supersonic. When the air and fuel are mixed in a pulse detonation engine, they’re ignited, creating deflagration like in any other combustion engine. However, within the longer exhaust tube, a powerful pressure wave compresses the unburnt fuel ahead of the ignition, heating it above ignition temperature in what is known as the deflagration-to-detonation transition (DDT). In other words, rather than burning through the fuel rapidly, it detonates, producing more thrust from the same amount of fuel; an explosion, rather than a rapid burn.

“The detonation process is a more rapid and efficient extraction of energy from your fuel from a thermodynamic standpoint when compared to deflagration,” Dee Howard endowed professor of hypersonic and aerospace engineering, Dr. Chris Combs, told Sandboxx News.

The detonations still occur in pulses, like in a pulsejet, but a pulse detonation engine is capable of propelling a vehicle to higher speeds, believed to be around Mach 5. Because detonation releases more energy than deflagration, detonation engines are more efficient — producing more thrust with less fuel, allowing for lighter loads and greater ranges.

detonation engine
Pulse Detonation Engine animation courtesy of Fred Schauer (AFRL/PRTS)

The detonation shockwave travels significantly faster than the deflagration wave leveraged by today’s jet engines, Trimble explained: up to 2,000 meters per second (4,475 miles per hour) compared to 10 meters per second from deflagration.

In May of 2008, the Air Force Research Laboratory made history by building the world’s first crewed pulse detonation-powered aircraft, using a Scaled Composites home-build plane called the Long-EZ. The unusual franken-plane managed a speed higher than 120 miles per hour during its test flight, with test pilot Pete Siebold at the stick, and reached altitudes between 60 and 100 feet.

detonation engine
The Long-EZ aircraft powered by a pulse detonation engine making its historic first flight. (Courtesy photo)

“This is a potential game-changer in terms of fuel efficiency,” The AFRL’s Propulsion Directorate’s Fred Schauer said of the PDE powering Long-EZ.

“For comparison, if we had operated this same engine with conventional combustion we would have made less than a third of the thrust for the same fuel burn. In comparison to traditional engines, fuel savings of 5 to 20 percent could be expected.”

The Air Force assessed at the time that improvements to their PDE engine could eventually propel aircraft to speeds beyond Mach 4, and higher if combined with other advanced propulsion systems like scramjets. A rotation detonation engine could be even more effective, but many within the academic and engineering communities questioned whether such an engine could ever actually be built.

Related: US announces successful tests of 3 hypersonic missiles in 2 weeks

The Rotation Detonation Engine emerges

A rotating detonation engine takes this concept to the next level. Rather than having the detonation wave travel out the back of the aircraft as propulsion, it travels around a circular channel within the engine itself.

Fuel and oxidizers are added to the channel through small holes, which are then struck and ignited by the rapidly circling detonation wave. The result is an engine that produces continuous thrust, rather than thrust in pulses, while still offering the improved efficiency of a detonation engine. Many rotation detonation engines have more than one detonation wave circling the chamber at the same time.

As Trimble explains, RDEs see pressure increase during detonation, whereas traditional jet engines see a total pressure loss during combustion, offering greater efficiency. In fact, rotation detonation engines are even more efficient than pulse detonation engines, which need the combustion chamber to be purged and refilled for each pulse.

“In theory, RDE is a bit like the leap from turbojets to turbofans in the 1960s, but for high-supersonic vehicles. It should give you a big jump in specific impulse (aka fuel efficiency), and if you can figure out how to package it in a way that doesn’t make things significantly heavier or less aerodynamic, you should be able to get a nice range boost out of it,” Trimble explained.

rotation detonation engine
Professor Kareem Ahmed, University of Central Florida

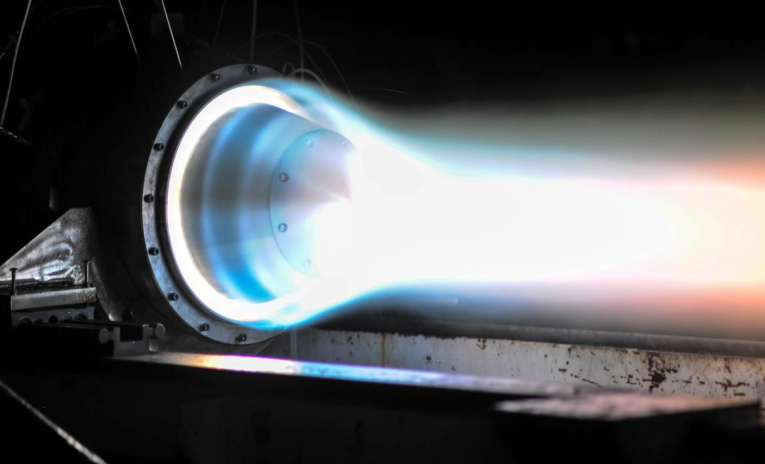
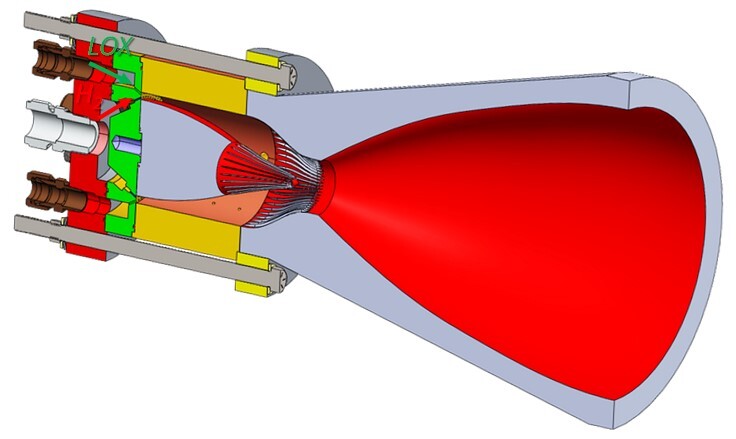
In 2020, a team out of the University of Central Florida, working with the Rotating Detonation Rocket Engine Program at the Air Force Research Laboratory, successfully built and tested the world’s first working rotation detonation engine that continued firing until its fuel was cut off, effectively proving the concept was possible. The three-inch copper test rig developed by the team successfully produced 200 pounds of thrust in laboratory conditions.

Since then, a number of other programs have followed suit, with noted engine manufacturer Pratt and Whitney among those leading the charge.

Related: How America almost got hypersonic aircraft decades ago

A new generation of high-speed, long-range weapons

RDE with vehicle concept
An RDE pictured integrated into the tail of a vehicle concept (U.S. Air Force/Air Force Research Laboratory via Aviation Week)

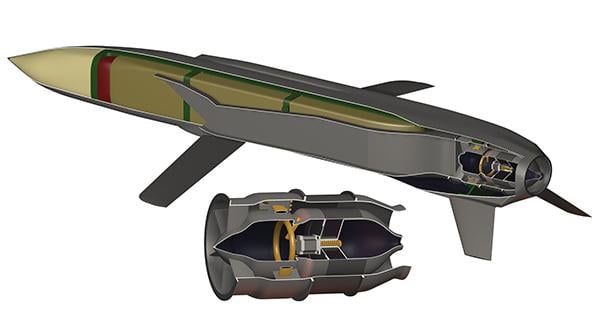
On July 18, DARPA released a Special Notice pertaining to their new Gambit Missile program, announcing a “Proposer’s Day” for firms to get more information about the effort and its aims. Within the notice, DARPA included a description of the program and its objectives, as well as their anticipated timeline, from inception to flight test.

“The objective of the Gambit program is to develop and demonstrate a novel Rotating Detonation Engine (RDE) propulsion system that enables a mass-producible, low-cost, high-supersonic, long-range weapon for air-to-ground strike in an anti-access/area denial (A2AD) environment.”

The program will be conducted in two 18-month phases. The first will entail competitors completing their preliminary designs with some limited testing, while the second would finalize designs and culminate in full-scale flight tests of an RDE system.

While the release offers scant details on the overarching goals of Gambit, some of the language within the announcement point toward specific challenges America’s defense apparatus currently finds itself facing. The reference to Gambit’s use in an “anti-access/area denial (A2AD) environment” could pertain to anywhere American forces are squaring off against a near-peer adversary. But there’s one such environment that has been the focus of multiple Defense efforts in recent years: the 1,000-mile-plus area denial bubble extending from Chinese shores thanks to a growing array of anti-ship weapon systems.

America’s carrier-based fighters, the F-35C and F/A-18 Super Hornet, each have a combat radius of less than 650 miles, which would mean having to sail carriers into harm’s way to launch combat sorties without longer-range munitions.

The United States obviously has the capability of fielding air-launched missiles with significant range, but it isn’t as simple as mounting a massive rocket under the Super Hornet’s wing, as Trimble points out. The size of these weapons matters a great deal, which is why RDE engines, with their improved efficiency and smaller mass, could be a game changer.

“That is probably most useful for the US Navy, which needs to find a way to equip fighters with long-range, high-speed (Mach 4-6) cruise missiles that are small enough to squeeze onto an aircraft carrier’s weapons elevators and land back on the carrier under a fighter’s wing without slamming into the deck.”

But Gambit isn’t the first new weapon program to leverage rotation detonation engine technology. According to the Air Force Research Lab, RDE technology could make high-speed weapons much more affordable, which is of particular import following a recent Defense Department analysis that indicated the hypersonic (Mach 5+) weapons in development for the Air Force may cost as much as $106 million each.

Hypersonic ARRW Readied for Booster Flight - Air Force Magazine
Artist depiction of the Air Force and Lockheed Martin’s AGM-183A ARRW hypersonic boost-glide weapon.

According to a list of efforts supported by the Pentagon’s High-Performance Computing Modernization program in 2022, the Air Force Research Lab has begun development on at least three RDE weapons or demonstrators.

One aims to field a liquid-fueled rotating detonation scramjet that will power an air-to-surface missile that can be carried internally by 5th generation fighters. Another will leverage solid fuel for an air-to-air missile, and a third effort aims to develop a vehicle for freejet testing on the ground.

RDE technology could eventually also lead to smaller weapons that offer the same range and speed as today’s missiles, allowing stealth aircraft like the F-35 to carry more munitions inside their internal weapons bays. Likewise, missiles of the same size as today’s could fly further faster, which has far-reaching benefits in both air-to-air and air-to-surface operations.

Related: Why calling Russia’s Kinzhal a ‘hypersonic missile’ is a stretch

Rotation Detonation Engines could power fighters and even the Navy’s warships

Misawa test cell Airmen run F-16 engines > 7th Air Force > Article Display
Testing an F-16 engine (U.S. Air Force photo)

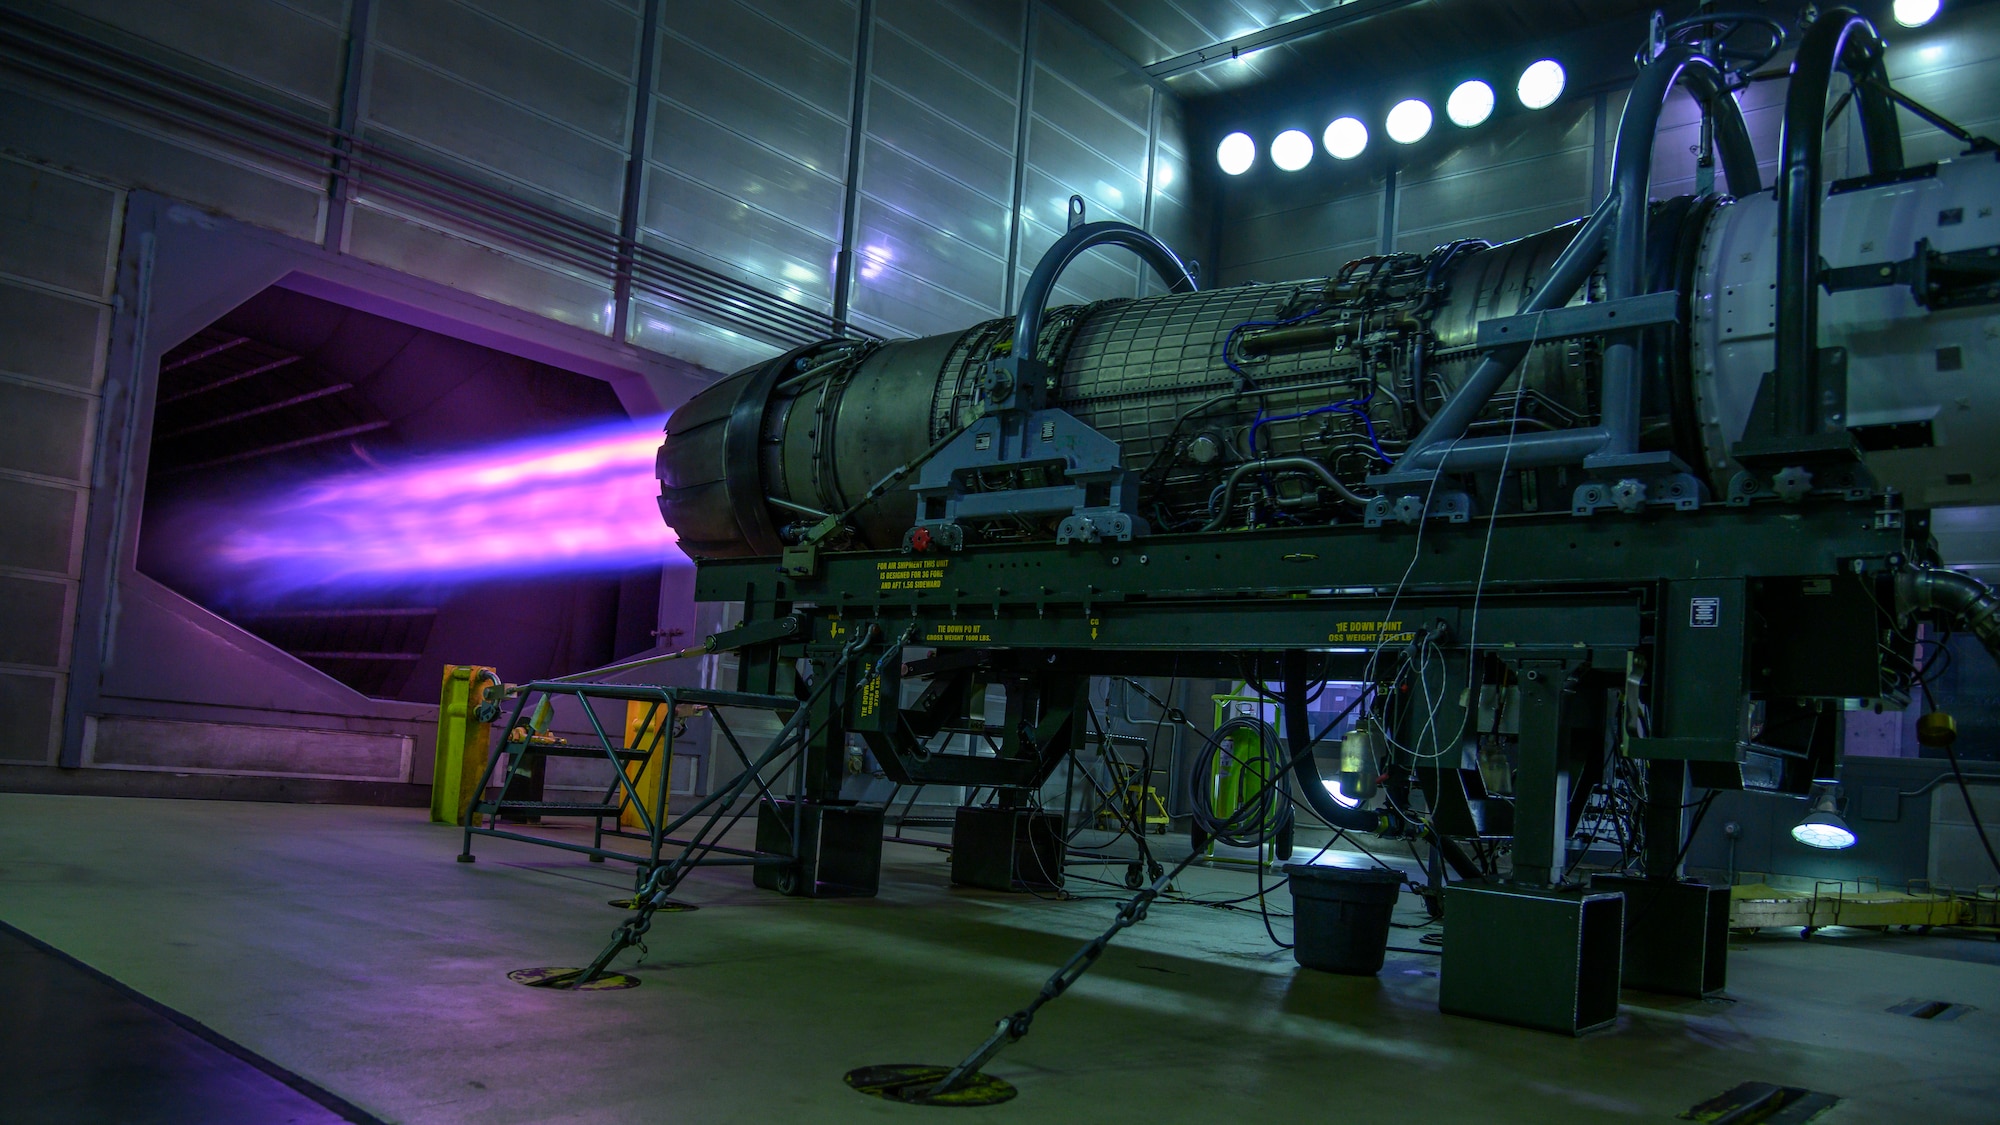
Among the weapon-oriented programs being developed by the Air Force Research Laboratory is another rotation detonation engine enterprise that could offer America’s fighters a big boost in range and speed: an RDE that could be used in place of a fighter’s afterburner.

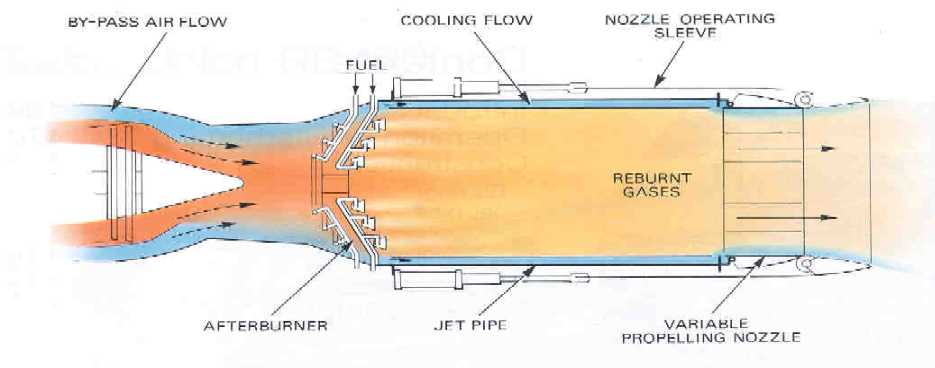
An afterburner effectively combines the remaining oxygen leaving the jet engine with more fuel by spraying fuel directly into the outflow of exhaust. Needless to say, this method of increasing thrust takes a heavy toll on the aircraft’s fuel stores, forcing pilots to choose between speed and range or loiter time.

Diagram courtesy of Purdue University

A rotation detonation engine afterburner could provide an increase in thrust while leveraging the design’s inherent efficiency, providing the same gains for less fuel expended.

In the longer term, air-breathing RDEs could even find their way into the fuselage of an aircraft as the primary means of propulsion. But not all of the potential applications for RDE’s are in the sky. One of the most promising may actually be out at sea.

While the Navy’s aircraft carriers and submarines are famously nuclear-powered, the rest of the fleet still runs on good old-fashioned F-76 marine diesel fuel — an estimated 86 million barrels of it in 2016 alone. So it may come as little surprise to you that the Navy has been very interested in this approach to high-efficiency propulsion. In fact, the Navy filed its own patent for a “rotary detonation engine” as far back as 1982.

The Arleigh Burke-class guided-missile destroyer USS Donald Cook (DDG 75) and USS Porter (DDG 78) conduct a connected replenishment with the USNS SUPPLY (T-AOE 6) to receive fuel and stores. (Photo by Royal Navy Photograher Dan Rosenbaum)

According to the Navy in 2012, rotation detonation engines could increase a warship’s thrust by 10% and reduce fuel consumption by 25%, giving them more speed and range for the fuel expended. In 2012, that kind of improvement was projected to result in savings of $300 to $400 million per year, which equates to $387 million to $516 million in today’s dollars.

The truth is, Rotation Detonation Engines could help fighters fly further, missiles fly faster, ships sail longer, and even rocket launches become cheaper. There aren’t many places in America’s defense apparatus this forward-reaching tech couldn’t benefit.

And while for many years the question surrounding RDEs was always if, increasingly, it now appears to be when.

Read more from Sandboxx News


hanson.stanford.edu

Rotating Detonation Engines


Rotating detonation engines (RDEs) are a promising technology for future propulsion and energy systems due to their high potential thermodynamic efficiencies and compact designs.

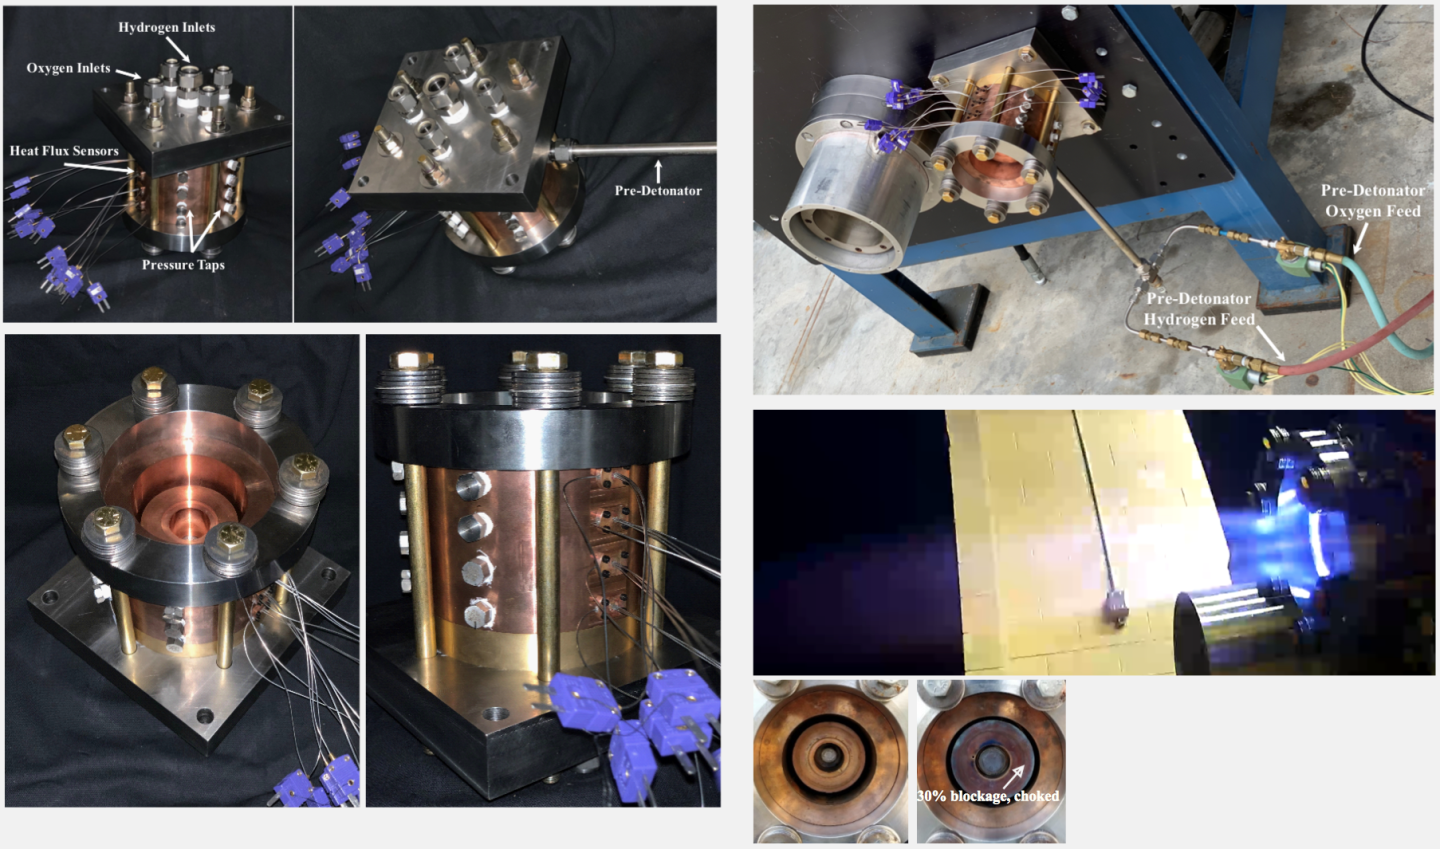
However, the development of these devices into robust, reliable systems requires continued experimentation. In the Hanson Research Group, we work with engine experts at the Naval Postgraduate School to support these experimentation efforts by developing laser sensors to measure H2O, CO2, CO, and temperature within their RDE combustors. The unique geometry of rotating detonation engine combustors led us to pioneer a single-ended sensor design, wherein laser light is both delivered and collected through the same window on the engine.

In combination with advanced diagnostic techniques that are able to overcome the intense vibration and thermal emission generated by the engine, our single-ended sensors provide crucial combustion data that will inform future rotating detonation engine designs.

A rotating detonation engine at the Naval Postgraduate School equipped with a single-ended laser sensor designed by the Hanson Research Group. The server rack (upper right) controls the lasers (lower right), which are connected to a fiber optic cable (center). Light from the fiber is delivered to and collected from the engine (lower left) by the detection assembly (upper left). Figure adapted from [4].

To learn more, check out some of our publications:

[1] Peng, W. Y., Goldenstein, C. S., Spearrin, R. M., Jeffries, J. B., Hanson, R. K., “Single-ended mid-infrared laser-absorption sensor for simultaneous in situ measurements of H2O, CO2, CO, and temperature in combustion flows,”

Applied Optics, Vol. 55, No. 33 (2016) pp. 9347–9359. DOI: 10.1364/ao.55.009347

[2] Peng, W. Y., Cassady, S. J., Strand, C. L., Goldenstein, C. S., Spearrin, R. M., Brophy, C. M., Jeffries, J. B., Hanson, R. K., “Single-ended mid-infrared laser-absorption sensor for time-resolved measurements of water concentration and temperature within the annulus of a rotating detonation engine,”

Proceedings of the Combustion Institute, Vol. 37, No. 2 (2019) pp. 1435–1443. DOI: 10.1016/j.proci.2018.05.021

[3] Cassady, S. J., Peng, W. Y., Strand, C. L., Dausen, D. F., Codoni, J. R., Brophy, C. M., Hanson, R. K., “Time-resolved, single-ended laser absorption thermometry and speciation in a H2/C2H4-fueled rotating detonation engine,”

Proceedings of the Combustion Institute, Vol. 38, No. 1 (2021) pp. 1719–1727. DOI: 10.1016/j.proci.2020.06.125

[4] Peng, W. Y., “Single-ended laser-based diagnostics for thermometry and speciation in detonation-driven combustors,”

Ph.D. Thesis, Stanford University (2019)


newatlas.com

World-first "impossible" rotating detonation engine fires up

By Loz Blain

A Florida team working with the US Air Force claims that it's built and tested an experimental model of a rotating detonation rocket engine, which uses spinning explosions inside a ring channel to create super-efficient thrust.

The vast majority of engines, of course, use combustion rather than detonation to achieve their output goals. Combustion is a relatively slow and controlled process resulting from the reaction between fuel and oxygen at high temperatures, and it's very well understood and mature as a technology.

Detonation, on the other hand, is fast and chaotic and much less predictable. An explosion instead of a burn, it is the massive discharge of energy you get when you break apart the chemical bonds holding an explosive molecule together by giving it a jolt of energy – either electrical or kinetic – in the form of a sufficiently powerful shockwave to destabilize those bonds. Detonation is excellent when you want to wreck stuff in bulk, and much harder to maintain precise control over.

But when you need to break the chains of the Earth's gravity and go to space, every gram of weight makes things that much harder and more expensive. Detonation releases significantly more energy from significantly less fuel mass than combustion, so for more than 60 years, rocket scientists have been working on the idea of a rotating detonation rocket as a potential way to cut down weight and add thrust.

Mechanically simple, the rotating detonation engine is dynamically very complex and requires precise timing and fuel delivery rates

Professor Kareem Ahmed, University of Central Florida

In essence, such a device starts with one cylinder inside another larger one, with a gap between them and some small holes or slits through which a detonation fuel mix can be pushed. Some form of ignition creates a detonation in that annular gap, which creates gases that are pushed out one end of the ring-shaped channel to produce thrust in the opposite direction. But it also creates a shockwave that propagates around the channel at around five times the speed of sound, and that shockwave can be used to ignite more detonations in a self-sustaining, rotating pattern if fuel is added in the right spots at the right times.

Pioneered by engineers at the University of Michigan in the 1950s, the rotating detonation engine is tantalizingly simple in a mechanical sense, but this self-propagating detonation wave has proven torturously difficult to achieve and sustain.

Until now, it seems. A team at the University of Central Florida, working alongside the Rotating Detonation Rocket Engine Program at the Air Force Research Laboratory, claims to have built and tested a working laboratory model. It's a 3-inch copper test rig using a mix of hydrogen and oxygen for fuel, which is the highest-performing rocket fuel for upper stage rocket engines.

"The study presents, for the first time, experimental evidence of a safe and functioning hydrogen and oxygen propellant detonation in a rotating detonation rocket engine," says Kareem Ahmed, an assistant professor in UCF's Department of Mechanical and Aerospace Engineering who led the research. "The detonation is sustained continuously until you cut off the fuel. We have tested up to 200 lbf, but the thrust increases linearly with the propellant mass flow."

The three-inch copper test rig has developed up to 200 lbf, but thrust will increase in a linear fashion as more fuel is added

Professor Kareem Ahmed, University of Central Florida

The secret, according to the researchers, was as simple as a tune-up.

"We have to tune the sizes of the jets releasing the propellants to enhance the mixing for a local hydrogen-oxygen mixture," Ahmed says. "So, when the rotating explosion comes by for this fresh mixture, it's still sustained. Because if you have your composition mixture slightly off, it will tend to deflagrate, or burn slowly instead of detonating."

"Just a few months prior, a number of US rocket engine experts had publicly declared that hydrogen-oxygen detonation engines were not possible," Ahmed tells New Atlas. "However, the paper presents experimental evidence and demonstrated without a doubt that detonation of oxygen and hydrogen are occurring within a rotating detonation rocket engine."

"These research results already are having repercussions across the international research community," says William Hargus, lead of the Air Force Research Laboratory's Rotating Detonation Rocket Engine Program, who is a co-author of the study. "Several projects are now re-examining hydrogen detonation combustion within rotating detonation rocket engines because of these results. I am very proud to be associated with this high-quality research."

Ahmed tells us this engine design is being evaluated as a possible replacement for Aerojet Rocketdyne's RL-10 rocket, which was first developed in 1962. Modern versions are still in production for the upper stages of Atlas V and Delta IV rockets, with further versions under development for the Exploration, OmegA and Vulcan rockets, but a proven rotating detonation rocket engine could be a real game-changer.

"The U.S. Air Force is targeting a rocket launch flight test by 2025," says Ahmed, "and we are contributing to achieving that goal."

While space propulsion is the key driver for this research, it also has potential terrestrial uses in other cases where high power and low fuel consumption could make a big difference. In 2012, the Naval Research Laboratory estimated that rotating detonation engines could save the Navy 15-20 percent off a ~US$2-billion annual fuel bill if they were retrofitted in place of the gas turbine engines that run over 100 of its large ships. They could also potentially be used in hypersonic and supersonic flights, or even electric power generation, and Ahmed tells us the design has potential as a booster stage engine as well, but it'd require a different type of propellant.

See a short slow-motion video of the rocket firing below.

Rotating Detonation Engine

The team has published their results in the journal Combustion and Flame.

Source: University of Central Florida


Saturday, July 2, 2022

A resilience systemic model for assessing critical supply chain disruptions - Oliver - - Systems Engineering - Wiley Online Library

A resilience systemic model for assessing critical supply chain disruptions - Oliver - - Systems Engineering - Wiley Online Library

onlinelibrary.wiley.com

A resilience systemic model for assessing critical supply chain disruptions

Everett Oliver

1 INTRODUCTION

Extreme natural events and manmade incidents cause disasters in large measure through their impact on critical infrastructure resources such as energy, transportation, water, communications, and healthcare systems. Due to system interdependencies, impacts to one set of critical infrastructure systems can cause cascading effects on other systems with devastating impacts on security, economic stability, public health, and safety.1 Supply chains in the United States are critical pieces of that infrastructure, representing a significant portion of the economy and touching every person and organization in the country. Supply chains deliver the products that support the lives and lifestyles of individuals and enable organizations to function. While all supply chains share certain characteristics, each one presents unique management challenges due to the nature of the products it supports.2

The knowledge contribution from this paper is a systems engineering methodology that extends existing analysis approaches by integrating systems modeling techniques and discrete event simulation (DES) to assess the resilience of supply chains against critical infrastructure disruptions.

Governmental regulations, consumer demands, and safety constrain food supply chains processing, storing, and transporting perishable food products,3 and health care supply chains delivering medical devices and pharmaceuticals.4 Modern consumer products and industrial systems utilize global supply chains and just-in-time manufacturing processes to achieve cost efficiencies at the expense of system resilience.5 Researchers have proposed a variety of approaches for assessing the risks to supply chains from disruptions to critical infrastructure systems. These approaches identify the need to apply modeling and analysis techniques across multiple levels of abstraction to capture the dynamic, decentralized interdependencies between organizations and systems representing many different critical infrastructure sectors.6, 7

Existing approaches to address these logistics risks have focused narrowly on different slices through the overall critical infrastructure system of systems: modeling public policy decision making,6 developing conceptual models of the “food-energy-water systems nexus,7” simulating the multi-level system of system interactions within a single critical infrastructure sector,8 or analyzing the responses of generic supply chains to upstream demand variance and downstream supply disruptions.9-11

Gaps in the current research on critical infrastructure sectors, systems, and supply chains arise from narrowly focusing on the immediate impact of disruption effects and excluding the tangible downstream impacts on society resulting from interdependency linkages to critical national supply chains. These gaps limit the ability of policy makers and infrastructure managers to implement policy and technical changes to avoid or mitigate the impact of cascading critical infrastructure failures on society which depends on these national resources.

The problem statements and research questions addressed in this study include:

Problem Statement 1 (PS1): Current descriptions of critical infrastructure resources in the United States and other countries exist in two primary levels of detail: 1) Very high level as represented in the National Infrastructure Protection Plan (NIPP 2013) and its associated sector-specific plans (SSPs) owned and maintained by the Department of Homeland Security (DHS) and other assigned sector-specific agencies (SSAs), or 2) Very low level system descriptions and diagrams owned and maintained by the companies and organizations that implement and support the physical and virtual critical infrastructure resources. No current description or system model exists that captures the critical infrastructure sector, system, and supply chain characteristics, components, functions, interconnections, and interdependencies. Research Question 1 (RQ1): Can system of systems modeling capture the interdependencies between critical infrastructure sectors, systems, supply chains, and the external environment?

Problem Statement 2 (PS2): No current methodology exists to assess the ability of critical national supply chains to satisfy society's demand for essential products and services such as food, water, energy, pharmaceutical products, medical devices, specialized equipment, and military supplies under normal conditions and when subjected to critical infrastructure disruptions. Research Question 2 (RQ2): Can systems engineering modeling and simulation support the performance assessment of supply chains under normal conditions and when subjected to critical infrastructure disruptions?

This paper demonstrates the application of modeling and simulation to the interdependencies between urban food supply chains and critical infrastructure systems in a case study. This methodology has application to any critical supply chain interactions with critical infrastructure and external environmental impacts.

The remainder of the paper provides a review of the literature, a detailed discussion of the proposed methodology, a case study applying the methodology to the New York City (NYC) food supply chain, conclusions, and future research directions.

2 BACKGROUND

Critical infrastructure systems and the supply chains that support them have developed over the years without centralized planning or management structures.6 As long as the systems work, no one pays much attention to their resilience against extreme natural events, manmade incidents, or other natural causes. It is only when a natural disaster, a cyberattack, or natural deterioration causes the loss of a critical resource that attention is drawn to the problem.12, 13 This research explores a holistic, systems engineering approach for assessing critical infrastructure systems and supply chains as interdependent systems of systems (SoS) to proactively assess their resilience against extreme events.

Systems engineering has a well understood role in the development of new systems. Within systems engineering, the definition of a system is very inclusive, encompassing food supply chains and all forms of critical infrastructure: “Systems are man-made, created and utilized to provide products or services in defined environments for the benefit of users and other stakeholders.14” This interdisciplinary approach views systems holistically through all phases of their life cycles. Systems engineering considers all the traditional engineering factors for accomplishing system goals to include desired capabilities, requirements, processes, and procedures. Additionally, systems engineering considers external constraints such as laws, contracts, standards, legacy processes, and environmental conditions.15

Systems engineering also provides valuable insights in assessing and mitigating existing systems. Within the context of this research, systems engineering techniques are proposed to conduct assessments intended to surface resilience gaps, identify stakeholder needs and generate policy and systemic requirements for critical infrastructure systems and supply chains. Systems engineering processes to support designing, implementing, testing, and sustaining the desired critical infrastructure improvements are outside the scope of this research.

Each of the 16 critical infrastructure sectors recognized by the United States (U.S.) government consists of large SoSs. An SoS is a system whose components are constituent independent systems integrated into a larger system delivering capabilities that are not possible through the constituent systems operating alone. Each SoS shares seven characteristics: “operational independence of the individual systems, managerial independence of the individual systems, geographical distribution, emergent behavior, evolutionary development, self-organization and adaptation.16

A U.S. Department of Defense study in 2008 divides the spectrum of SoS types into four categories based on the relationships between the SoS's constituent systems. From loosely coupled to tightly coupled, the SoS categories are16-18:

  • Virtual: constituent systems lack a central management authority and a centrally agreed upon purpose,
  • Collaborative: constituent systems interact more or less voluntarily to fulfill agreed upon central purposes,
  • Acknowledged: constituent systems have recognized objectives, a designated manager, and resources; and retain their independent ownership, objectives, funding, development, and sustainment approaches,
  • Directed: constituent systems form an integrated SoS built and centrally managed to fulfill specific purposes.

Supply chain systems supporting one company or controlled by one company can be modeled as directed or acknowledged SoSs. U.S. critical infrastructure SSPs identify national and global supply chains associated with many of the sectors including: commercial facilities, critical manufacturing, energy, food and agriculture, healthcare, and transportation.19 These critical infrastructure supply chains would be considered collaborative SoSs with informal agreements on central purposes and without centralized management.

Public-sector and academic research studies identify natural and manmade threats to selected critical infrastructure systems in the United States and other countries. Multiple researchers describe the cascading effects of disturbances on interdependent, critical infrastructure systems—focusing on the impacts to national energy systems.20-24 Setola, et al. (2016) reported that TNO (the Netherlands Organization for applied scientific research) identifies “more than 9,550 CI [critical infrastructure] disruption events causing the failure of 12,400 infrastructure services through cascading [failures] between 2005 and [2016].1” Table 1 lists four representative cascading critical infrastructure failures in the United States since 2012. Superstorm Sandy will be used as an example to demonstrate the utilization of the methodology presented in this article because data regarding societal impacts are more readily available for that incident.

TABLE 1. Cascading critical infrastructure disruption examples within the United States
Disruption Source Year Impact Description
Colonial Pipeline Ransomware Attack 2021 In May 2021, the Colonial Pipeline Company halted pipeline operations supplying liquid fuel to the East Coast region of the United States in response to a “DarkSide ransomware-as-a-service (RaaS)” attack.62
Covid-19 Pandemic 2020 Through the end of 2021, the Covid-19 pandemic infected over 288 million people worldwide, killing over 5.4 million. In the United States, Covid-19 infected over 54 million people, killing over 827,000. In 2022, the pandemic is continuing to infect and kill millions of people worldwide including in the United States.63 This pandemic directly impacted people supporting critical infrastructure sectors in the United States and cascaded into other sectors.60, 61
SolarWinds Hack 2020 The SolarWinds hack introduced malicious software into an official SolarWinds Orion software update by directly accessing the SolarWinds update server. The malicious update allowed the hackers to breach the networks of SolarWinds clients which include many U.S. government agencies and critical infrastructure providers.64, 65
Superstorm Sandy 2012 Superstorm Sandy impacted the northeast coast of the United States in the vicinity of New York City causing major damage due to storm surge and flooding. Immediate disruptions were felt by the energy and transportation critical infrastructure sectors, leading to cascading impacts to the food supply chain.49

Researchers identify different approaches for understanding the risks to supply chains from natural and manmade disruptions to critical infrastructure systems. At a policy level, Oughton et al. (2018) proposes a system of systems approach for modeling the emergent, interdependent behaviors of national critical infrastructure systems focusing on energy, transportation, digital, waste, and water systems in the United Kingdom.6 Zimmerman et al. (2018) presents a conceptual food supply chain network model linking food, energy, and water systems in the aftermath of Superstorm Sandy in NYC that identifies and visualizes the interrelationships between critical infrastructure components affecting the food supply chain.7 M. Montoya et al. (2021) identifies the need for enhanced logistical monitoring and tracing in the pharmaceutical cold chain to ensure product quality.4

Recent research focuses on the impacts to supply chain planning from bullwhip and ripple effects. The bullwhip effect occurs when high-probability-low-impact distortions in customer demand cause a larger variance in upstream demand (i.e., variance amplification). Although the bullwhip effect can be reduced by the introduction of common knowledge (optimal decisions at each node in the chain) and maintaining excess or coordination stock, these mitigations do not completely eliminate the effect. In addition, the degree of decentralization in critical infrastructure supply chains precludes real-time feedback sufficient to support optimal decisions at each node. The ripple effect results when low-probability-high-impact disruption events such as natural and manmade disasters cause supply disruptions to move downstream toward the retailers. Dynamic supply chain simulations also demonstrate that downstream ripple effects can amplify upstream bullwhip effects and increase the variability in product orders.9-11

While highlighting the need for a systems approach when researching critical infrastructure disruptions, these studies focus narrowly on different slices through the overall critical infrastructure system of systems. As a result, they do not provide a means for demonstrating the tangible societal impacts resulting from critical infrastructure disruptions when interdependency linkages allow cascading failures to affect critical national supply chains. These gaps limit the ability of policy makers and infrastructure managers to implement policy and technical changes to avoid or mitigate the impact of cascading critical infrastructure failures on society which depends on these national resources.

Modern systems engineering utilizes model-based systems engineering (MBSE), a concept originated by the International Council on Systems Engineering (INCOSE) in 2007. The systems engineering modeling language (SysML) used in MBSE is based on the Unified Modeling Language (UML) adopted by software engineering in the 1990s.16 SysML describes the structure and behaviors of systems and SoSs while capturing a wide range of supporting artifacts: laws, standards, requirements, contracts, mathematical relationships and more.15 These SysML models can feed analysis and simulation tools to optimize system parameters and assess system behaviors.

Supply chain mathematical models depend on inventory management processes to make procurement and scheduling decisions. Analytical methods generate optimal solutions for static models. However, for dynamic systems with complicated mathematical models or what-if questions regarding critical infrastructure disruption impacts, other options such as simulation are more appropriate. The large number of interactions between independent components within critical infrastructure supply chain systems suggests that simulation methods are most appropriate for assessing their resilience against disruptions to other critical infrastructure systems.25, 26

The history of simulation began over 200 years ago with manual simulation techniques used to estimate π in the Buffon-Laplace needle experiment, and by William Sealy Gosset to formulate the Student's t-distribution.27 The development of modern simulation methods followed the development of computer systems starting in the 1940s.28 Simulation methods in use today are tailored to the system that they are simulating based on three questions about the system's characteristics: 1) Is the system static or dynamic? 2) Are system parameters deterministic or stochastic? 3) Is the system's domain continuous or discrete?16

Ravitz et al. (2016) identify four simulation paradigms that are relevant to simulating systems found in the healthcare industry (one of the critical infrastructure sectors):

  • System Dynamics (SD) features a “simplified system representation through aggregation and average flow rates [with less] data requirements relative to other paradigms.29
  • DES models the operation in discrete time steps. DES supports granular movement of resources through a supply network.29
  • Agent-Based Simulation (ABS) models system components as atomic, interacting agents. “ABS affords very granular levels of disaggregation and interaction among agents.29
  • Hybrid Simulation combines two or more of the other simulation paradigms.29

As dynamic systems representing product movements through the network, supply chains in steady state conditions are well suited for any of these simulation paradigms. However, SD is less useful for assessing supply chain response to large disruptions where it is desirable to study the responses of the supply chain nodes at a more granular level.

This research uses a hybrid supply chain simulation model consisting of independent, autonomous agents conducting discrete event transactions between component systems supplying products in response to stochastic end-customer demand functions. The model implements a partial ABS capability in that the supplier-distribution center-retailer structure is static while each node and link in the supply chain network responds autonomously to supply and demand signals. DES models the dynamic actions of the systems implementing discrete transactions between nodes in the supply chain.

Pinho et al. (2018) and Scholz et al. (2018) describe the application of DES for simulating work flow processes and supply chain operations.26, 30, 31 Free software simulation packages such as SimPy32 and Simmer33 supporting DES are available for the Python and R programming languages respectively. This research uses the SimPy package to implement the discrete event interactions between supply chain nodes within a Python program.34, 35 The object-oriented capabilities in the Python programming language simulate the autonomous inventory management functions at each of the supply chain nodes. Disaster impacts are simulated through transportation, energy, water, and other critical infrastructure disruptions affecting the performance of specific supply chain resources.26, 30, 31

3 METHODOLOGY

This proposed system modeling and simulation methodology integrates two distinct MBSE activities that have not been used together to facilitate supply chain analysis: system modeling using SysML and DES using SimPy.

3.1 System modeling

The methodology proposed in this research models supply chains in the context of their environment which facilitates identifying and assessing the impacts of environmental disruptions on the supply chain.

Building the supply chain system model begins with identifying the constituent systems and their functions within the supply chain, and the environment or system context in which the supply chain operates. Figure 1 illustrates the processing steps, product flows and information exchanges for a generic critical infrastructure supply chain showing its role in producing, processing, and transporting products from the raw material sources to the end consumers. In this diagram, products flow downstream from raw material sources to the end customers, while orders flow upstream from the end customers. This illustration does not consider the supply chain's environment and interdependencies with other critical infrastructure systems.

Details are in the caption following the image

Generic critical infrastructure supply chain showing product and information flows

SSPs (e.g., the plans for the critical manufacturing, and healthcare and public health sectors) emphasize each sectors’ reliance on global supply chains which depend on other critical infrastructure sectors. Figure 2 places the generic high-level supply chain within its system context and identifies its interactions and interdependencies with critical infrastructure sectors. Three of the interdependent sectors (water and wastewater, energy, and transportation) are considered critical lifeline sectors because they support all critical infrastructure sectors. Other critical infrastructure resources needed by the supply chain reside in the commercial facilities sector which provides retail outlets for selling products to consumers, and the supply chain's parent sector which provides production, processing and distribution facilities.19

Details are in the caption following the image

Supply chain and critical infrastructure interdependency context diagram

Critical supply chains adopt lean inventory and just-in-time practices to reduce cost and improve efficiency, which increases their susceptibility to supply chain impacts caused by external disruptions. The arrows between critical infrastructure sector components and the supply chain networks represent physical critical infrastructure resources required to enable supply chain functions. Similar interdependencies and resource exchanges between other critical infrastructure sectors are indicated by arrows between those sectors’ components. This web of interdependencies showing the flow of resources between critical infrastructure sectors and the supply chain reveals potential paths for cascading impacts due to critical infrastructure disruptions.19

Translating the system context diagram into SysML to support analysis and simulation is an iterative process that begins with identifying and describing the high-level structure and behaviors of the system. Each subsequent iteration of the system modeling process decomposes the constituent parts of the supply chain, producing a more detailed view of its components, processes, and interfaces. SysML uses a graphical modeling approach to provide consistent representations of system components and behaviors that are understandable to multiple system stakeholders. The GENESYS® software product is used for this research to perform the SysML modeling.36

The SysML interface block diagram in Figure 3 displays the high-level physical interfaces between the supply chain and a relevant subset of critical infrastructure sectors. Subsequent decompositions of the supply chain structural model break out the individual components of the specific supply chain and identify their interdependencies with components of the other critical infrastructure systems.

Details are in the caption following the image

Supply chain and critical infrastructure interdependency SysML interface block diagram

SysML behavioral diagrams depict the activities, processes, behaviors, and state transitions exhibited by the functional components of the system. Activity diagrams focus on the activities and processes performed by each of the functional components. State transition diagrams treat the system components as state machines, displaying the system states and state transitions as the system responds to internal and external events. The activity diagram in Figure 4 displays the overall function of the supply chain in the context of its relationships with the relevant, interdependent, critical infrastructure systems. This diagram includes the resource transfers and information exchanges between the supply chain system, raw material sources, customers, and other critical infrastructure systems. Decomposition of the behavioral diagrams identifies the processes, product flows, and information exchanges within and between each of the specific supply chain's constituent systems. Examples of decomposed processing node activity and state transition diagrams are shown in the case study below for an urban food distribution network.

Details are in the caption following the image

Supply chain and critical infrastructure interdependency SysML activity diagram

SysML models of the critical infrastructure systems provide valuable insights into the structure and interdependencies between the systems and allow qualitative assessments of the impacts from disasters on these systems. This research has focused on a subset of SysML diagrams that would be relevant to most critical infrastructure interdependency situations. However, this focus is not intended to diminish the utility of other SysML diagrams where appropriate to express interdependency impacts.

To make quantitative evaluations of those interdependency impacts, the models are subjected to analytical or simulation-based assessments. For this research, the system models and critical infrastructure disruptions are used to develop a simulation to determine the magnitude and duration of food supply chain impacts for specific disruptions. Because the GENESYS® software product does not support direct generation or execution of Python simulation software, the DES code is written and executed manually.

3.2 Simulation

The simulation approach selected for a specific type of supply chain depends on the modeled supply chain system characteristics. National and global distributed critical infrastructure supply chains implement dynamic (time-dependent) behaviors for order handling, internal processing, and transportation. Key supply chain parameters such as customer demand, processing times, transportation lead times, and inventory levels are stochastic. The products supported by these supply chains can be modeled as discrete units such as boxes of food or medical supplies, individual appliances, or items of industrial equipment. Based on this assessment, these supply chains exhibit dynamic, stochastic, and discrete system characteristics, consistent with DES using stochastic modeling of system parameters as the most appropriate simulation technique.

Building the DES supply chain simulation begins with translating the SysML structural diagrams, activity diagrams and state transition diagrams into simulation modules. The supply chain simulation consists of modules for each of the major components of the supply chain: raw material production sites, processing facilities, distribution centers, retailers and transportation links between the production, processing, distribution, and point-of-sale locations. The independent, autonomous components of the supply chain are identified from the structural diagrams, and the interactions between the components are identified from the associated activity and state transition diagrams. Each of the major autonomous components is implemented as an object and its internal activities – the inventory management processes – are implemented as functions. The inventory management functions for the raw material sources, production sites, processing facilities, distribution centers, and retailers are the primary activities that require specific implementation.

Within each individual production, processing, storage, distribution and retail facility of the supply chain, inventory management processes coordinate product order decisions in response to customer demands. Each facility sells products from inventory. When inventory drops to or below the pre-determined reorder point, an order is placed with the facility's supplier. After the procurement lead time, the order is received and placed into inventory. Figure 5 shows a simplified flowchart of the internal inventory management processes in an individual supply chain node. Under ideal circumstances in a theoretical inventory management process, the order is received just as the inventory in stock reaches the planned minimum safety stock level. The order replenishes the stock to the peak inventory level as shown in Figure 6, and the process continues.37

Details are in the caption following the image

Generic supply chain node order processing and inventory management flowchart

Details are in the caption following the image

Supply chain theoretical inventory cycle

In reality, demand for the product is seldom uniform or predetermined, and procurement lead times can be variable. The inventory management process incorporates safety stock to manage the risk that the facility sells out of the product before the next order is received. Depending on the sales model for the facility, items that go out of stock will either be backordered for delivery when additional stock is received or represent lost sales. Figure 7 represents a more realistic inventory management model for supply chain facilities.37

Details are in the caption following the image

Supply chain realistic inventory cycle

In addition to the variability in end-customer demand, multi-tier supply chains such as critical infrastructure supply chains experience the bullwhip effect in which demand variability increases when moving upstream in the supply chain. The result of the bullwhip effect is that variability in demand and inventory levels are higher for distribution centers than for retailers, and higher still for processors and producers.11

Optimizing a realistic inventory cycle requires accurate estimates of future product demand (the forecast demand) and the reorder lead time. The uncertainty in those demand and lead time estimates factor into the safety stock calculation. Many forecasting techniques are candidates to support inventory management: moving averages, historical data including seasonal and cyclical patterns, and heuristics. This research considers two inventory management methodologies:

  • Exponentially weighted moving averages (simple exponential smoothing) to estimate the forecast demand and its uncertainty, and target cycle service levels (CSL) for determining reorder points.38
  • Frequent (daily) deliveries to replenish each day's demand.39

For both inventory management approaches, the demand, D(t), is modeled at time t as a mean, μD, and an error term, ε(t):

Dt=μD+εt \begin{equation}D\left( t \right)\ = {\mu }_D\ + \varepsilon \left( t \right)\end{equation}

(1)

Using simple exponential smoothing, Graves (1998) shows that the forecast, F(t), for such a demand process at time t is given by38

Ft=αDt1+1αFt1 \begin{equation}F\left( t \right)\ = \ \alpha D\left( {t - 1} \right) + \left( {1 - \alpha } \right)F\left( {t - 1} \right)\end{equation}

(2)

Exponential smoothing of the mean squared errors (MSE(t)) is used to estimate the standard deviation of the forecast demand at time t, σF̂ $\widehat {{\sigma }_F}$(t)40

MSEt=αDt1Ft2+1α·MSEt1 \begin{equation}MSE\left( t \right)\ = \alpha ^{\prime}\ {\left( {D\left( {t - 1} \right) - F\left( t \right)} \right)}^2 + \left( {1 - \alpha ^{\prime}} \right) \cdot MSE\left( {t - 1} \right)\end{equation}

(3)

σF̂t=MSEt \begin{equation}\widehat {{\sigma }_F}\left( t \right)\ = \ \sqrt {MSE\left( t \right)} \end{equation}

(4)

From Graves (1998), the relationships between lead time, L(t), σF̂(t) $\widehat {{\sigma }_F}( t )$, σF̂(t+L(t)) $\widehat {{\sigma }_F}( {t + L( t )} )$ and the safety stock requirement, S(t), based on target CSL for a single-tier system that allows negative demand and backorders unfulfilled demand are given by38

σF̂t+Lt=σF̂tLt1+αLt1+16α2Lt12Lt1 \begin{equation}\widehat {{\sigma }_F}\left( {t + L\left( t \right)} \right)\ = \widehat {{\sigma }_F}\ \left( t \right)\sqrt {L\left( t \right)} \sqrt {1 + \alpha \left( {L\left( t \right) - 1} \right) + \frac{1}{6}{\alpha }^2\left( {L\left( t \right) - 1} \right)\left( {2L\left( t \right) - 1} \right)} \end{equation}

(5)

St=kσF̂t+Lt \begin{equation}S\left( t \right)\ = \ k\widehat {{\sigma }_F}\left( {t + L\left( t \right)} \right)\end{equation}

(6)

k=Φ1CSL \begin{equation}k\ = {{{\Phi}}}^{ - 1}\ \left( {CSL} \right)\end{equation}

(7)

The relationships between the current inventory, I(t), orders placed to the supplier, O(t), work in progress, W(t), and the inventory position, P(t), are given by:

Wtn=i=0nOti,Oti=0,OtireceivedOti,Otinotreceived \begin{equation}W\left( {{t}_n} \right) = \sum\limits_{i = 0}^n {O^{\prime}\left( {{t}_i} \right)} ,O^{\prime}\left( {{t}_i} \right) = \left\{ { \def\eqcellsep{&}\begin{array}{@{}*{1}{c}@{}} {0,O\left( {{t}_i} \right)\ received}\\ {O\left( {{t}_i} \right),O\left( {{t}_i} \right)\ not\ received} \end{array} } \right.\ \end{equation}

(8)

Pt=It+Wt \begin{equation}P\ \left( t \right) = \ I\left( t \right) + W\left( t \right)\end{equation}

(9)

The reorder point, ROP(t), is determined by the safety stock requirement and the forecast demand until the order is delivered.

ROPt=St+Lt·Ft \begin{equation}ROP\ \left( t \right) = \ S\left( t \right) + L\left( t \right) \cdot F\left( t \right)\end{equation}

(10)

Whenever the inventory position drops below the reorder point, a new order is placed. With the current inventory position, lead time for the reorder, desired inventory after receipt of the reorder of I(t+L(t)), and maximum inventory level of M(t), the reorder quantity, O(t), is given by:

Ot=maxIt+LtPt+Lt·Ft+Lt,Mt \begin{equation}O\ \left( t \right) = \ max\left( {\left( {I\left( {t + L\left( t \right)} \right) - P\left( t \right)} \right) + L\left( t \right) \cdot F\left( {t + L\left( t \right)} \right),\ M\left( t \right)} \right)\end{equation}

(11)

Replenishing the inventory every day to replace the previous day's demand, is a simpler inventory management process more commonly used by small retailers with limited storage capacity. This process requires placing daily orders, potentially maintaining more stock than required to meet demand, and missing out on quantity discounts.39

In the daily replenishment inventory management approach, the retailer places an order each day based on that day's sales, O(t), and receives the order placed the previous day, Q(t). There is no specific inventory position for triggering a reorder. The order quantities, work in progress and inventory position are given by:

Pt=It+Wt \begin{equation}P\ \left( t \right) = \ I\left( t \right) + W\left( t \right)\end{equation}

(12)

Ot=MtPt \begin{equation}O\ \left( t \right) = \ M\left( t \right) - P\left( t \right)\end{equation}

(13)

Wt+1=Wt+OtQt \begin{equation}W\ \left( {t + 1} \right) = \ W\left( t \right) + O\left( t \right) - Q\left( t \right)\end{equation}

(14)

Depending on the supply chain's product, external environmental impacts and critical infrastructure disruptions may impact the supply chain processing and distribution nodes and the transportation links. Within the nodes, additional processing, and handling delays, τN, are incurred, and portions of the product may be wasted due to spoilage, wN(t+τN). In the links, portions of the product may be delayed, τT, wasted due to spoilage, wT(t+τT), or returned to the previous node, RT (t+τT).

The disruption-impacted product flow through a node is given by:

QNoutt+τN=1sNQNint \begin{equation}{Q}_{{N}_{out}}\ \left( {t + {\tau }_N} \right) = \left( {1 - {s}_N} \right)\ {Q}_{{N}_{in}}\left( t \right)\end{equation}

(15)

wNt+τN=sNQNint \begin{equation}{w}_N\ \left( {t + {\tau }_N} \right) = {s}_N{Q}_{{N}_{in}}\ \left( t \right)\end{equation}

(16)

The disruption-impacted product flow through a transportation link is given by:

QToutt+τT=1sT+rTQTint \begin{equation}{Q}_{{T}_{out}}\ \left( {t + {\tau }_T} \right) = \left( {1 - \left( {{s}_T + {r}_T} \right)} \right)\ {Q}_{{T}_{in}}\left( t \right)\end{equation}

(17)

wTt+τT=sTQTint \begin{equation}{w}_T\ \left( {t + {\tau }_T} \right) = {s}_T{Q}_{{T}_{in}}\ \left( t \right)\end{equation}

(18)

RTt+τT=rTQTint \begin{equation}{R}_T\ \left( {t + {\tau }_T} \right) = {r}_T\ {Q}_{{T}_{in}}\left( t \right)\end{equation}

(19)

An example of the manually generated Python SimPy code used to simulate retailer processing based on the above inventory management algorithms is included in Appendix A. Similar software modules were developed to simulate the food producer and distribution center processes including the internal processing times and transportation delays between each of the supply chain nodes.

4 APPLICATION AND RESULTS FOR MODELING AND SIMULATION METHODOLOGY

The target system for applying this modeling and simulation methodology is the U.S. food supply chain. This case study focuses on the food distribution network that supplies the five boroughs of NYC and the impacts of Superstorm Sandy in October 2012.

4.1 Urban food supply chain background and context

The food supply system in the U.S. represents a significant portion of the economy and touches every person living in or visiting the country. Sales of domestic agricultural products in 2017 totaled $390 billion split evenly between crops and livestock.41 Food products are also a large factor in international trade with exports of $143 billion and imports of $128 billion in 2018.42 Within the United States, 660,755 restaurants,43 38,571 supermarkets,44 and other retail food outlets and institutional food service establishments supply food products to a population of 327 million45 and an estimated 80 million visitors46 every year.

Recognizing the importance of a safe, secure and reliable food supply to the nation's security, economic stability, public health and safety, the U.S. government designates the food and agriculture sector as 1 of 16 critical infrastructure sectors in the United States.19 The food and agriculture sector encompasses all aspects of the food supply system including crop and animal production; processing and packaging of harvested food products; transportation, storage, and distribution to retail facilities; and sale of food products to end consumers.2 To maintain product freshness and safety, food supply chains have more stringent characteristics than other supply chains such as “higher requirements for storage, transportation, (and) processing.3

Since 1950, the world has experienced a significant shift of population from rural to urban areas. In 2018, 55% of the global population and 82% of the U.S. population resided in urban areas, up from 30% and 64% in 1950.47 With the increasing urbanization globally and in the United States, ensuring secure and resilient delivery of food to major cities and other urban centers takes on increasing importance.

The logistical aspects of the food supply chain and interdependencies to other critical infrastructure sectors are particularly significant when considering urban food supply chain systems. Increased population density leads to closely situated and heavily interconnected transportation systems, energy systems, and water and wastewater systems. Food distribution centers congregate where land and transportation hubs are available. The proximity of these critical infrastructure systems and their interdependencies increase the likelihood that extreme natural events or manmade incidents will impact multiple systems and cause cascading disruptions impacting the food supply chain system.39, 48-50

Within the urban setting, food supply chains evolve to compensate for space and critical infrastructure restrictions within densely populated areas. Studies focused on NYC identify these notable characteristics of urban food supply chains39, 49, 50:

  • Multiple suppliers generally located outside the urban area,
  • Multiple distribution centers and warehouses inside or on the boundary of the urban area,
  • Multiple consumer point of sale locations within the urban area,
  • Heavy reliance on trucks for transportation and delivery of food,
  • Many-to-many relationships between suppliers, distribution centers and point of sale locations,
  • Just-in-time inventory processes due to storage space limitations,
  • Limited built-in resilience measures to protect against critical infrastructure failures,
  • Reliance on insurance rather than backup systems to protect businesses from losses due to food supply chain failures.

Urban food supply chains exhibit many characteristics that increase the impact of supply chain disruptions: Supply chain density represented by the close geographical spacing of nodes, supply chain complexity measured by the number of nodes and supply flows between distribution centers and retailers, node criticality given by the number of critical distribution nodes and recovery capability constrained by the number of alternate nodes and transportation routes.48

To protect against out-of-stock conditions resulting from significant supply chain disruptions, recent research encourages retailers with sufficient storage space to coordinate with suppliers and distributors to purchase extra inventory above safety stock levels on a consignment basis as a risk mitigation strategy. Unfortunately, urban retailers with limited storage space lack this ability to maintain consignment capacity to supply customers in the event of supply chain disruptions.51

Accommodating their storage space limitations, urban retailers rely on just-in-time inventory processes and frequent deliveries to maintain sufficient inventory to support daily demand.39, 50 While just-in-time processes are efficient and cost effective with consistent supply and demand, they are not good at handling high demand variance. This strategy of reducing inventory levels to improve efficiency can lead to insufficient stock to handle large-scale supply chain disruptions.52

Individual food supply chains fall into different SoS categories. Those that support large grocery store chains such as Walmart or Kroger's could be considered directed SoSs as they have a high degree of centralization where the company centrally manages most of the network.53 In contrast, food supply chains supporting urban metropolitan areas have a centrally agreed upon purpose but are otherwise highly decentralized with little or no central management in line with the collaborative SoS categorization.16, 18

4.2 New York City food supply chain overview

With a 2018 population of 8.4 million, NYC is the most populous city in the United States.46 It is also a very popular tourist destination and financial center with over 65 million visitors per year54 and hundreds of thousands of daily commuters who travel to the city to work.50

Providing food to such a large population requires a large network of suppliers, distribution centers, transportation resources, and retail outlets. Based on a 2016 NYC food resilience study, this food system distributes approximately 19 billion pounds of food through approximately 42,000 point-of-sale outlets annually. Nearly half (46%) of this food is perishable (either refrigerated or frozen), with shorter shelf-life and higher infrastructure requirements. Due to the limited amount of on-site food storage capacity, smaller point-of-sale outlets rely on frequent (daily) food deliveries and a just-in-time inventory process. As a result, the NYC food system maintains approximately 4 to 5 days of stock on hand on average. Table 2 categorizes the primary food point-of-sale locations in the city and their contributions to the overall food supply chain.50

TABLE 2. NYC primary food point-of-sale outlet types and contribution to consumer sales
Point-of-Sale Type Portion of locations Number of locations (approx.) Portion of food quantity sales Average daily food quantity sales per location in pounds (approx.) Average quantity of food in stock (days)
Independent Restaurants and Cafés 47% 19700 40% 1100 3–4 days
Supermarkets 2% 800 24% 14900 6–7 days
Bodegas 25% 10500 18% 900 3–5 days
Food Markets 3% 1300 7% 2900 4–5 days
Quick Service Restaurants 5% 2100 4% 1000 3–4 days
Other 18% 7600 7% 500 7–10 days

Most food shipments destined for NYC originate outside of the city making their way to wholesalers and distributors in the city and surrounding region. Each individual retailer in the city receives food supplies from one or more wholesalers or distributors. Major national food distribution companies maintain most of their warehouses outside the city boundaries in New Jersey, Connecticut, and New York state. Within the city, the Hunts Point Food Distribution Center is in the Bronx, major meat markets are in Brooklyn and Manhattan, and specialized foods markets are in Queens and Manhattan.49 The overall structure of this food supply chain resembles an hourglass: a very large number of initial producers and processors supplying a limited number of wholesalers and distributers who supply approximately 42,000 retailers. These retailers feed more than 8 million people in NYC every day.

The Hunts Point Food Distribution Center in the Bronx fills a major role in supplying the point-of-sale outlets in NYC through three cooperative markets and six large distributors. “About 60 percent of the city's produce and about half of the city's meat and fish passes through Hunts Point for sale and distribution to retailers and consumers.55” In addition to Hunts Point, major food distribution clusters supporting the city are located in Manhattan, Brooklyn, and Queens. Loss of electrical power at distribution centers and retailers will quickly reduce the salability of their food inventory.49, 50

The large number of food distributors serving NYC indicate that there is little risk from disruption to a single distributor. However, the limited quantity of locally grown food, clustering of distributors in major distribution centers, and interdependencies with energy and transportation systems create risks related to critical infrastructure disruptions.39, 50

The NYC food supply chain relies on trucks and delivery vehicles to supply the distribution centers and point-of-sale retailers. These vehicles require gasoline or diesel fuel which is delivered to NYC service stations from three primary sources: refineries in New Jersey and Pennsylvania, pipelines from Gulf Coast refineries and marine tankers. Because most service stations in NYC are required by contract to source their fuel from specific suppliers, the impact from disruption to any of these suppliers can be extensive.49

Figure 8 illustrates the food supply chain flowchart for the most relevant components of the NYC food distribution network. For the case study, this analysis focuses on the critical infrastructure disruption impacts to the distribution centers and local retailers.

Details are in the caption following the image

Food supply chain process flowchart with critical infrastructure disruptions

4.3 New York City food supply chain model

Building the NYC food supply chain model begins with the high-level SysML interface block diagram and activity diagrams, Figures 3 and 4, and the NYC food distribution flowchart, Figure 8.

Iterative decomposition of the NYC food supply chain model produces detailed activity diagrams identifying the functional interactions within the components of the supply chain. The activity diagrams in Figures 9 and 10 decompose major nodes of the supply chain showing the internal processes and resource transfers within the distribution center and retailer models. These diagrams show the flows of inventory information and orders, and the processing of food products to satisfy the orders.

Details are in the caption following the image

Food supply chain distribution center SysML activity diagram

Details are in the caption following the image

Food supply chain retailer SysML activity diagram

Each interconnection or interaction between the food supply chain and other critical infrastructure sectors represents a potential disruption point of the food supply to urban customers. SysML state transition diagrams, such as Figure 11, model the impacts of external critical infrastructure disruptions on the food supply chain. This figure represents the state transitions for the delivery transportation function of the supply chain responsible for delivering food products from distribution centers to retailers. Transitions from the Loaded and Refueled states illustrate how critical infrastructure disruptions impact food delivery. Disruptions to the fuel supply or the transportation infrastructure trigger Fuel Unavailable or Roads Unusable transitions causing the delivery order to be unloaded and cancelled, followed by the delivery vehicle returning to its depot to await another order.

Details are in the caption following the image

Food supply chain delivery transportation SysML state transition diagram showing transportation infrastructure disruption impacts

The SysML structural and behavioral modeling capabilities described here and in the Methodology section address RQ1 by demonstrating the ability to capture the static and dynamic characteristics of the interdependencies between critical infrastructure sectors, systems, supply chains, and the external environment. Structural modeling supports the multi-tier architecture and interdependency structure of critical infrastructure supply chains and systems such as food supply chains. Behavioral modeling captures the interactions between supply chain system components and interdependencies with external critical infrastructure systems.

4.4 Validating the simulation model

To validate the accuracy of the DES simulation model, supply chain simulation results are compared statistically to theoretical supply chain results using forecast demand estimates, safety stock calculations and target out-of-stock rates. The validation assessment uses a single-tier (single retailer and single supplier) model for two, feasible, retailer inventory management processes: reorder points based on target CSL, and frequent (daily) deliveries to replenish daily product sales.

For these simulations, the daily demand at the retailer in arbitrary units (boxes, weight, or parts as appropriate to the product) is normally distributed with μD = 1000 and σD = 200. Customer demand is modeled as a single order for each daily time step. These daily orders are the triggering events for the DES processing.

For the first model, the theoretical algorithm using target CSL to set the reorder point allows for negative demand and backordering of unfulfilled orders.38 Because the case study demonstrating this methodology is focused on food products, the simulation model assumes non-negative demand and no backordering. Due to these real-world constraints on the model, some differences from the theoretical results are expected. The four simulation graphs in the top of Figure 12 show the fraction of reorders maintaining sufficient inventory to avoid out-of-stock situations as a function of CSL, storage capacity and procurement lead times.

Details are in the caption following the image

Fraction of product reorders received before “stock out” as a function of CSL and for daily reorders

For larger storage capacities, the simulation results approximate the target CSLs. T-test results in Table 3 confirm this observation for seven combinations of CSL, storage capacity and lead time where the null hypothesis cannot be rejected at a p-value of .05 indicating that simulation results are consistent with the target CSL. For other combinations of CSL, storage capacity and lead time, the null hypothesis is rejected confirming that the simulation results are inconsistent with the target CSL. Because the simulation results without tight storage capacity constraints approximate the theoretical results for target CSL, the simulation can be considered a reasonable model for the supply chain when sufficient storage capacity is available.

TABLE 3. T-test of reorder simulation results compared to target CSL value (p-value = .05)
Cycle service level (CSL) Storage capacity (Days) Lead time (Days) T-statistic Sample size p-value
0.90 6 4 −1.6527 20 .1148
0.90 8 6 −1.0485 20 .3076
0.90 10 7 −0.7929 20 .4376
0.90 10 9 −0.3190 20 .7532
0.95 10 6 −0.5011 20 .6221
0.95 10 8 1.3931 20 .1797
0.98 10 8 −1.7259 20 .1006

For the second model using daily replenishment, the bottom graph in Figure 12 shows that a retailer never goes out-of-stock if the storage capacity (measured in days of demand) exceeds the procurement lead time by three days or more. This is consistent with the reported experiences of NYC retailers when sufficient storage capacity is available to support the procurement lead time.39

4.5 Food supply chain disruption: Superstorm sandy impacts New York City

The specific natural disaster used to demonstrate the effects of interdependent critical infrastructure disruptions on the food supply chain was Superstorm Sandy which made landfall in NYC on October 29, 2012. Arriving at high tide in New York Harbor with a tropical force wind field 1000 miles in diameter and generating a 14-foot storm surge, Sandy caused significant damage in NYC. In total, Sandy caused 43 deaths, $19 billion in damages and significant food supply chain disruption to the inundated neighborhoods in Brooklyn and Queens.49

Superstorm Sandy caused major, short-term transportation disruptions to roads, bridges and tunnels stopping most traffic into and out of the city for two days. Within a week most bridges and tunnels into the city recovered allowing food deliveries to resume to major warehouses and distribution centers. However, some areas of the city saw longer impacts because of extensive road damage and lack of liquid fuel deliveries limiting the ability to deliver food to retailers.49 Aside from the first few days after Superstorm Sandy's landfall, this disaster primarily impacted the last mile of the food supply chain from the wholesalers and distribution centers to the point-of-sale retailers and the end consumers.

The majority of the NYC food supply systems were resilient and recovered quickly from Superstorm Sandy. However, local officials noted that the impact could have been much worse if the storm had arrived at high tide in the Long Island Sound and flooded the critical Hunts Point Distribution Center.55 It was a different story in areas of the city that were inundated by storm surge, “whole neighborhoods found themselves with limited or no retail food access.49” The simulation model in this paper is used to assess Superstorm Sandy's impact on the hardest hit sections of NYC: the Rockaway peninsula and Broad Channel in Queens, and the Coney Island, Brighton Beach and Red Hook neighborhoods in Brooklyn.49

The NYC food supply chain simulation model focuses on three point-of-sale outlet categories: Independent restaurants and cafés, bodegas, and quick service restaurants. These retailers represent 77% of the retail outlet locations and 62% of the food sold by weight in the city. As shown in Table 2, each of these point-of-sale outlets sell approximately 1000 pounds of food per day on average and maintain an in-stock inventory to support three to five days of customer demand.50

The simulated food supply chain consists of ten retailers supported by one distribution center and one supplier. Two inventory management approaches are implemented in the simulation:

  • For the distribution center, a simple exponential smoothing algorithm forecasts future demand to calculate safety stock, reorder points, and reorder quantities. Transportation time for inbound orders is included in the inventory calculations, however, little or no food processing occurs at the distribution centers.38, 39
  • For the retailers, a continuous delivery inventory management process places daily orders to the distribution center to replenish each day's sales. Food processing occurs at the retailers but does not significantly affect the response to customer demand.39, 50

When applying this simulation methodology to assess the response of urban food supply chains to critical infrastructure disruptions, interactions between external, critical infrastructure systems, and the food supply chains are implemented based on their direct impacts to supply chain components. The magnitude and extent of the disruptions are determined by data from natural disasters and major equipment outages, as well as estimated effects from climate change. These critical infrastructure system disruptions are input into the simulation modules associated with the impacted supply chain functions. Disruption of fuel supplies and damage to transportation infrastructure impacts transportation systems causing order cancelations or increases in delivery lead times. Loss of electrical power impacts food processing and refrigerated storage at distribution centers and retailers, and creates second order effects to fuel supply, communications, electrically powered transportation, and other critical infrastructure resources.10, 49, 50

Monte Carlo simulations of the full food supply chain system model are executed without critical infrastructure disruptions to establish a baseline statistical model of the system performance, and with disruptions to assess the disruption response. Comparisons of the statistical performance models with and without critical infrastructure disruptions provide insights into the current system resilience. Analyses with and without system modifications support what-if assessments of impact mitigations.

For this case study, two specific disruptions occurring simultaneously are simulated:

  • Flooding affecting the transportation infrastructure causing a complete stop to food transportation within the city affecting distribution centers and retailers for 2 days with a gradual return to full service in 5 days.49
  • Storm surge and flooding affecting food delivery to retailers in the hardest hit portions of the city by disabling liquid fuel delivery and reducing fuel availability to approximately 20% of normal capacity for 2 weeks with a gradual return to normal service within a month.49

Depending on the amount of warning before the disaster, retailers may experience demand fluctuations before, during and after the disruptions. The simulation models two demand cases: 1) constant demand, and 2) increased demand a few days before the disruption followed by decreased demand for a few days immediately afterward. From contemporary news reports, food retailers throughout the NYC area experienced a demand spike for staple food items in the days before Superstorm Sandy made landfall and a return to normal demand a few days after the storm passed.56

Following Superstorm Sandy, the inundated areas of Rockaway peninsula, Coney Island, Brighton Beach, and Red Hook with a population of approximately 350,00057 experienced significant food shortages through the normal food supply chains which were severely impacted by the fuel shortages. When normal food supply systems started to function again, larger retail food chains and restaurants outside the hardest hit areas were able to recover within a few days. However, the hardest hit regions were mostly served by smaller stores and restaurants that had a harder time reopening with their distributors waiting in gasoline lines and dealing with traffic restrictions.56

During the weeks following Superstorm Sandy, NYC first responders, National Guard troops, a NYC contracted food supplier and the NYC Food Truck Association provided 3.9 million meals to the residents of these impacted neighborhoods.58 Although official data sources do not record the time distribution for the emergency meals, contemporary reporting suggests that most of the meals were delivered in the immediate aftermath of Superstorm Sandy. The New York National Guard reported delivering over 2.5 million meals in the first two weeks after the storm.59 Assuming that the 3.9 million meals were distributed within a month after Sandy's landfall when the response effort shifted from emergency response to rebuilding, 37% of the residents of the most impacted areas received meals every day.

The simulation output plots in Figure 13 show retailer inventory and demand under non-impacted and impacted conditions. In the retailer demand plots, customer demand is shown in blue, and demand satisfied is shown in red. The left-hand set of plots show the experience of a single, representative retailer. The right-hand set of plots show the average retailer experience for the set of 10 retailers over a 20-repetition, 365-day Monte Carlo simulation. In the simulation, Superstorm Sandy landfall occurs on day 150. These simulation plots reflect the food supply shortfall necessitating the emergency food supply response. The emergency food supplies are not included in the demand satisfied curves because the available emergency response data do not have sufficient granularity to map to the simulation results.

Details are in the caption following the image

Monte Carlo simulation results for food supply chain impact from storm surge and flooding for a single representative retailer and an average of all retailers

Single retailer simulation results illustrate the effects of inconsistent resupply causing multiple inventory outages. Averaged, multiple-retailer results show the smoothing effect of aggregating the performance of individual retailers each experiencing inventory outages at different times.

During the 30-day disruption period in the simulation, the unsatisfied food demand is approximately 34% for the Monte Carlo simulation without demand fluctuations and 39% with demand fluctuations. The demand spike caused by panic buying in the days immediately before a predicted storm creates unsatisfied demand before the storm arrives and increases the overall food shortage. This simulation result compares favorably with the percentage of impacted residents (approximately 37%) who received daily emergency food supplies in the form of ready-to-eat or prepared meals in the immediate aftermath of Superstorm Sandy.

4.6 Results summary and comparison to prior research

The NYC food supply chain simulation results above address RQ2 by demonstrating that this modeling and simulation methodology can describe and assess the performance of an urban food supply system under normal conditions and when subjected to critical infrastructure disruptions.

Prior research addressed the challenge of assessing critical infrastructure supply chain performance at multiple levels. Oughton et al. (2018) articulated a case study based on the United Kingdom critical infrastructure sectors “which applies complex adaptive systems properties to the development of a national infrastructure system-of-systems model.6” Similarly, Zimmerman et al. (2018) developed a conceptual network model based on the impacts of Superstorm Sandy to the nexus of “food, energy, and water systems” in New York City. These studies produced high-level models for policy makers to understand the nature of interconnections and interdependencies between critical infrastructure sectors to “identify, visualize, and analyze these interconnections.7” While these studies provide structures for developing critical infrastructure SoS models, they don't provide sufficient detail to implement the models or integrate simulation and analysis tools for assessing the impacts of cascading critical infrastructure disruptions.

Dolgui et al. (2020) developed hybrid DES and ABS simulation models to investigate the effectiveness of coordination between customers and suppliers to mitigate the bullwhip effect caused by inventory capacity disruption at the supplier.11 While this is valuable research to understand the mechanics of the ripple and bullwhip effects, it is not useful for critical infrastructure supply chains where the collaborative SoS structure does not support that level of coordination.

Scholz et al. (2018) and Pinho et al. (2018) researched methodologies for optimizing biomass fuel supply chains using multiple optimization tools and techniques and DESs. These articles identified the availability of a comprehensive set of software tools, and the successful use of genetic algorithms and particle swarm optimization methodologies in a closed loop control structure for optimal replanning in the supply chain.26, 30, 31 Montoya et al. (2021) in a literature review studying pharmaceutical cold chains identified the need for enhanced logistical monitoring and tracing to ensure product quality.4 These research studies were useful for supply chains implementing near real time monitoring, reporting, and replanning capabilities. However, they are not relevant for critical infrastructure supply chains where the independence of the components precludes this level of information sharing.

5 CONCLUSIONS

The nation's critical infrastructure is a web of systems supplying energy, water, transportation, healthcare, financial services, food and much more to communities throughout the nation. In 2012, Superstorm Sandy caused significant disruptions to the residents of NYC when interdependencies between the energy, transportation, and food and agriculture critical infrastructure sectors caused cascading effects to the NYC food supply system.49 In 2020 and 2021, the COVID-19 pandemic exposed significant resilience issues within healthcare, food, consumer product and industrial supply chains.5 The pandemic impacted multiple supply chains through illnesses and pandemic mitigation measures affecting workers in production, processing and logistics roles. Worker outages disrupted industries worldwide, including food supply chains supplying produce and meats throughout the United States.60, 61 Sudden changes in demand for products as different as paper face masks and medical ventilators created shortages throughout the healthcare industry.5

The need to address the logistics risks in supply chains caused by interdependencies between critical infrastructure sectors has been identified as a gap by many researchers. Existing approaches to address these logistics risks focus narrowly on different slices through the overall critical infrastructure system of systems: modeling public policy decision making,6 developing conceptual models of the “food-energy-water systems nexus7”, simulating the multi-level system of system interactions within a single critical infrastructure sector,8 or analyzing the responses of generic supply chains to upstream demand variance and downstream supply disruptions.9-11 Gaps in the current research arise from excluding the tangible downstream impacts on society resulting from interdependency linkages to critical national supply chains.

The methodology described in this paper provides a mechanism for addressing this gap in assessing critical infrastructure supply chain resilience and the associated risks to society from concerns such as climate change, natural disasters, and manmade incidents. Systems modeling and simulation have been used independently for many years in systems engineering and other disciplines. Integrating them to produce greater insights into the interactions between SOS to assess the resilience of interdependent critical infrastructure systems and supply chains is a new capability introduced in this research.

Looking beyond food supply chain impacts from natural disasters, every critical infrastructure supply chain distributes products that are essential for the functioning of modern society. The methodology developed in this paper should be used to assess other critical infrastructure supply chains including the chemical supply chain, the energy supply chains, the healthcare products supply chain, the information technology supply chain, and the water and wastewater supply chain. Assessing the resilience of these supply chains should be a priority task for policy makers and critical infrastructure managers. This methodology provides the mechanisms for conducting those assessments.

When applying this methodology to another critical infrastructure supply chain, the relevant SSP provides a first-order identification of the associated critical infrastructure sector's systems, and interdependencies. Iteratively decomposing the critical infrastructure sector components associated with the supply chain of interest using SysML yields system models with identifiable impact points for manmade or natural disruptions. Mapping the supply chain product flows to the system model ties the supply chain nodes and links to physical system components and disruption impact points. From this model, a DES is developed incorporating delays and product outages in response to relevant disruptions. This DES then becomes a tool for visualizing the effect of changing supply chain processing parameters, evaluating the impact of critical infrastructure disruptions, and assessing the effectiveness of policy- or technology-based mitigations.

This methodology pulls together modeling and simulation techniques that are part of the existing systems engineering toolkit. Using these techniques to bridge the gaps and provide a more detailed understanding of the interactions and interdependencies between critical infrastructure sectors, systems, and supply chains represents a new addition to the body of knowledge. Each disruption scenario presented in this article reveals currently unexplored interdependencies that can be addressed through this modeling and simulation methodology. Due to the flexibility of these modeling and simulation techniques, critical infrastructure managers, policy makers and researchers can adapt them to analyze the interactions between any interdependent critical infrastructure sectors, systems, or supply chains.

An additional application of this methodology would be in assessing the effectiveness of potential mitigations proposed to alleviate impacts from specific disruptions. Possible mitigation assessment examples associated with a scenario such as Superstorm Sandy's impact on the NYC food supply system could include evaluating the effect of increasing inventory capacities at distribution center or point of sale supply chain nodes, storage capacities at fuel depots, and modifying emergency fuel resource policies to give critical supply chain transportation services priority access to fuel.

Limitations in this study included: 1) insufficient data on the individual components and interactions of the NYC food supply chain needed to develop a more-detailed interdependency simulation of the system, 2) insufficient data on emergency meal distribution following Superstorm Sandy needed to more accurately validate the simulation demand shortfall, and 3) insufficient interdependency and product distribution data needed for system modeling and simulation of other critical infrastructure supply chains.

The methodology developed in this study is an initial effort to address the analysis gaps associated with understanding and mitigating the impacts of cascading critical infrastructure disruptions on critical national supply chains. This study has identified significant linkages between the transportation, energy, and food and agriculture critical infrastructure sectors that can impact the food supply chains to major urban areas. Future research should investigate other interdependency linkages between sectors, systems, and supply chains, particularly those that do not involve exchanges of physical resources. Identifying additional interdependency linkages would be a first step toward mitigating new disruption conditions.

Future research should also investigate the integration of system modeling with other simulation and analysis methodologies in place of DES. Depending on the specific interactions and interdependencies between sectors, systems, and supply chains or the nature of the disruptions, SD models or ABS may be more suitable simulation methodologies.

APPENDIX A

Python SimPy Discrete Event Simulation Code Example

An example subset of the manually generated Python SimPy code used to simulate retailer processing is shown here:

# -*- coding: utf-8 -*-

"""

Example section of supply chain model for Retailer processing. Distribution centers and food suppliers have similar processing steps but will include lead times to deliver products to the next supply chain step, different reorder processes, and different impact functions.

The SimPy package manages the simulation environment (env) that is used by the object class functions to synchronize processes to the simulation time. Using Python generators, functions prematurely exit and then reenter at the point of last exit.

Current simulation time within the SimPy environment is identified by self.env.now.

For this simulation, the time steps are in days. G.simTime is the global variable setting the maximum number of days in each simulation loop.

Three global variables are used by the Retailer class to uniquely identify each retailer, return order quantities delivered from distribution centers and orders cancelled due to lack of products at the distribution centers.

"""

import simpy

import numpy as np

from scipy import stats

# Global Constants

class G:

simTime = 365

totalR = 10

# Global variables

class I:

nRetailers = 0 # Unique identifier number for each retailer

orderSatisfiedR = np.zeros((G.totalR, G.simTime)) # Order delivered to retailer

orderCanceledR = np.zeros((G.totalR, G.simTime)) # Order cancelled by dist.center

class Retailer(object):

def __init__(self, env, dc, capacity, name = ''):

self.env = env

self.rNumber = I.nRetailers

self.dc = dc

self.capacityR = capacity

self.inventoryR = capacity

self.inventoryPositionR = capacity

self.workInProgressR = 0

self.demandR = np.zeros((G.simTime))

self.demandSatisfiedR = np.zeros((G.simTime))

if (name == ''):

self.name = 'R_' + str(I.nRetailers)

I.nRetailers += 1

else:

self.name = name

# Calls monitorRInventory on each simulation step to maintain retailer

# inventory

self.monProcR = env.process(self.monitorRInventory(env))

# Function handling customer orders

def processCustomerOrder(self, env, demand):

# Customer demand added to list

self.demandR[self.env.now] += demand

# Retailer will satisfy the larger of the customer request or food in inventory

if (self.inventoryR < demand):

demandSatisfied = self.inventoryR

else:

demandSatisfied = demand

self.demandSatisfiedR[self.env.now] += demandSatisfied

# Inventory is updated to reflect the sale

self.inventoryR = self.inventoryR - demandSatisfied

self.inventoryPositionR = self.inventoryR + self.workInProgressR

# Quantity of food is delivered to the customer

return demandSatisfied

# Function to manage retailer inventory and place orders to distribution center

def monitorRInventory(self, env):

# Re-entry point for each simulation step

while True:

# Reduce storage capacity in response to manmade or natural events.

currentCapacityR = self.capacityR * self.capacityImpactR()

# Reduce current inventory in response to manmade or natural events

self.inventoryR *= self.inventoryImpactR()

# Using I.orderSatisfiedR and I.orderCanceledR global variables to

# transfer food products (or order cancellation information) from

# distribution centers to the retailer

if (I.orderSatisfiedR[self.rNumber, self.env.now] > 0):

self.workInProgressR = 0

if (I.orderCanceledR[self.rNumber, self.env.now] > 0):

self.workInProgressR = self.workInProgressR - I.orderCanceledR[self.rNumber,

self.env.now]

self.inventoryR += I.orderSatisfiedR[self.rNumber, self.env.now]

self.inventoryPositionR = self.inventoryR + self.

# Identify reorder quantity needed and update inventory statistics

reorder = currentCapacityR - self.inventoryPositionR

self.workInProgressR = self.workInProgressR + reorder

self.inventoryPositionR = self.inventoryR + self.workInProgressR

# Send reorder to distribution center and exit function. Order (or

# order cancellation) will be provided through I.orderSatisfiedR and

# I.orderCanceledR global variables.

self.env.process(self.dc.respondDCOrders(env, self, reorder))

yield self.env.timeout(1)

# Function to perform inventory adjustment due to external factors. Example shows

# case with no impacts. Function would be customized to reflect fractional inventory

# losses at a particular simulation time given by self.env.now. Losses could be due

# to power failures or other external events.

def inventoryImpactR(self):

return 1

# Function to perform storage capacity adjustment due to external factors. Example

# shows case with no impacts. Function would be customized to reflect fractional

# storage capacity decreases at a particular simulation time given by self.env.now.

# Capacity decreases could be due to physical destruction, flooding or other external

# events.

def capacityImpactR(self):

return 1

Biographies

  • image

    Everett Oliver holds a B.S. in Engineering Physics from the U.S. Naval Academy, M.S. degrees in Computer Science and Applied Physics from The Johns Hopkins University, and a PhD in Systems Engineering from The George Washington University. He has over 30 years of experience supporting development, integration, and testing of commercial and military systems.

  • image

    Thomas A. Mazzuchi, D.Sc. holds a B.A. in Mathematics from Gettysburg College, Gettysburg, Pennsylvania; and the M.S. (1979) and D.Sc. (1982), both in Operations Research, from The George Washington University, Washington, D.C. Currently he is Professor of Engineering Management and Systems Engineering, and Chair of the Department of Engineering Management and Systems Engineering, in the School of Engineering and Applied Science at GW. Dr. Mazzuchi has been engaged in consulting and research in the areas of reliability and risk analysis, and systems engineering techniques, for more than 30 years.

  • image

    Shahram Sarkani, Ph.D., P.E., is Professor of Engineering Management and Systems Engineering at The George Washington University. His current administrative appointments are inaugural Director, School of Engineering and Applied Science Off-Campus and Professional Programs and Faculty Adviser and Academic Director, EMSE Off-Campus Programs. Professor Sarkani joined GW in 1986. Professor Sarkani's research in systems engineering, systems analysis, and applied enterprise systems engineering has application to risk analysis, structural safety, and reliability. He has conducted sponsored research for such organizations as NASA, NIST, NSF, US AID, and the U.S. Departments of Interior, Navy, and Transportation.

REFERENCES


New Fusion Record Achieved in Tungsten-Encased Reactor

New Fusion Record Achieved in Tungsten-Encased Reactor Isaac Schultz Summary The WEST (Tungsten Environm...