In recent years, lead-free piezoelectric ceramic devices have been extensively researched and applied in the high-frequency range, specifically above 20 kHz, for airborne acoustics applications. However, few applications have been reported on low-frequency underwater acoustic transducers, which are crucial in the fields of underwater acoustic communication, ocean resource development, etc., because this imposes more stringent requirements for lead-free piezoelectric ceramics in terms of size, mechanical coupling coefficient, piezoelectric coefficients, and temperature stability. This paper explores the application of high-performance potassium sodium niobate based lead-free piezoelectric ceramics in a low-frequency directional wideband transducer. It covers design, fabrication, and performance testing of the transducer. The transducer measures Φ236 × 83 mm2 and weighs 4.45 kg, which achieves wideband emission (3500–8200 Hz) and directional sound emission with a front-to-back sound pressure ratio exceeding 6 dB across a significant frequency range. Both the theoretical analysis and the experimental results confirm the competitiveness application of the lead-free piezoelectric ceramics in the field of low-frequency underwater acoustic transducers applications.
The underwater acoustic transducer, as a key component for emitting and receiving sound waves in underwater navigation, positioning, detection, and communication processes, plays a crucial role in fields such as marine science research and ocean resource development.1 The performance of the transducers heavily relies on the functional materials used for energy conversion, with Pb-based piezoelectric ceramics being widely applied due to their high piezoelectric performance and mature fabrication techniques. Nevertheless, Pb-based ceramics have several significant drawbacks. First, the high lead content exceeding 60% poses potential irreversible harm to human health and the environment during manufacturing, usage, and disposal, leading to international restrictions on lead-containing piezoelectric ceramics.2 Second, Pb-based piezoceramics feature high density, which significantly increases the weight of the transducer and further limits its size when considering the capacity of the transducer mounting platform. Since the resonant frequency of the transducer is directly related to its size, with larger dimensions resulting in lower resonant frequencies, Pb-based underwater acoustic transducers can hardly achieve low-frequency emission, thus hindering the enhancement of the transmission distance of underwater acoustic signals.
Therefore, many researchers are dedicated to developing lead-free piezoceramics as alternatives. In this context, various compositions, such as BaTiO3 (BT),3 Bi0.5Na0.5TiO3,4 (K, Na)NbO3 (KNN),5 and their derivatives, have been reported.6–11 Among them, (K, Na)NbO3 (KNN) based ceramics, with desirable piezoelectric response and high Curie temperature, are considered one of the most promising alternatives. However, current studies on lead-free piezoelectric ceramics primarily focus on applications in ultrasound transducers,12–14 resonators,15 piezoelectric motors, and buzzers,16,17 but few report on their use in underwater transducers.
KNN-based piezoelectric ceramics with chemical engineering exhibit outstanding comparable piezoelectric and dielectric properties comparable to conventional PZT ceramics, along with even higher thickness vibration electromechanical coupling coefficients k and lower values. Transducers employing KNN-based ceramics in longitudinal mode demonstrated emission performance comparable to that of transducers using PZT ceramics.18 These preliminary findings imply that KNN-based lead-free piezoelectric ceramics are adequate for underwater acoustic transducers. Nevertheless, owing to the relatively straightforward design of longitudinal mode transducers and the limited mass fraction of active materials within the transducer, the full potential of KNN-based lead-free ceramics remains underutilized in satisfying the requirements of low-frequency underwater acoustic transducers.
With advancement in the fabrication process of lead-free piezoelectric ceramics, this study selects a large-sized KNN-based ceramic bar as the active material to drive the device, aiming to design a low-frequency directional wideband transducer. In the medium to low-frequency range, a common transducer is piezoelectric ceramic annular ring owing to several advantages, such as small size, simple structure, and good electroacoustic performance.19 When used as an emission transducer, the piezoelectric ceramic annular ring typically operates at the first-order resonance frequency, known as the breathing mode vibration, emitting sound in all directions. However, in certain specific application scenarios, such as underwater communication, omnidirectional transducers have drawbacks such as poor signal-to-noise ratio and high energy consumption. Directional transducers offer more efficient communication, making them valuable in practical applications. Currently, there are two main approaches to achieving low-frequency directionality in annular transducers. One involves exciting specific vibration modes through electrical signals to focus sound.20,21 The other adds acoustic barriers to control sound direction.22 These methods, while effective, inevitably introduce complexity, increase size, and add weight to the transducer, which brings inconvenience to practical use. In this study, a deformable structure is proposed, namely, a modified piezoelectric annular ring, combining a piezoelectric ceramic ring with a metal embedded cylindrical structure. This configuration, marked by axial asymmetry, couples the annular ring and liquid cavity for vibration. By fine-adjusting the structural parameters, the transducer not only emits dipole radiation but also an additional monopole radiation component beyond the dipole sources, achieving low-frequency directionality without the complexity of multi-source control. Multimode coupling broadens the bandwidth, enabling the wideband emission spanning over one octave. Subsequently, we designed and crafted a prototype low-frequency directional wideband transducer using KNN-based lead-free piezoelectric ceramics. With rigorous testing in an anechoic pool and the results compared to simulations, the promising performance of the underwater acoustic transducer was demonstrated. This work further enhances the application of KNN-based lead-free piezoelectric ceramics in the field of low-frequency directional transducers.
The primary challenge in fabricating a low-frequency underwater transducer with uniform performance and high piezoelectric constant is manufacturing a sufficiently large piezoelectric ceramic block. In this study, 96 samples of KNN-based lead-free piezoelectric ceramics measuring approximately 75 × 9 × 5.5 mm3 [as shown in Fig. 1(a)] were utilized. The characteristics of these samples as well as a comparison of their performance with traditional lead-based piezoelectric ceramics, are listed in Table I.23,24
FIG. 1.
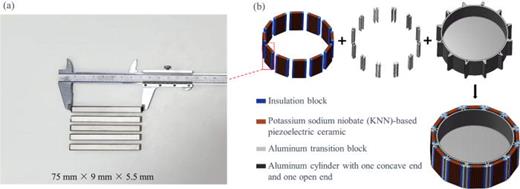
(a) Samples of KNN-based lead-free piezoelectric ceramic bars. (b) Schematic procedure of the designed transducer structure.
FIG. 1.
(a) Samples of KNN-based lead-free piezoelectric ceramic bars. (b) Schematic procedure of the designed transducer structure.
Close modal
TABLE I.
Performance comparison of KNN-based lead-free piezoelectric ceramics with PZT-8 and PZT-4.
| This work | PZT-8 | PZT-4 | Influence on the transducer | |
|---|---|---|---|---|
| Density (kg·m−3) | 4417 | 7600 | 7500 | Reduced weight |
| Equivalent Young's modulus (GPa) | 85.9 | 86 | 85 | |
| Equivalent Poisson's ratio | 0.41 | 0.3 | 0.3 | |
| Relative dielectric constant | 1974 | 1100 | 1050 | |
| Piezoelectric constant (pC·N-1) | 330 | 240 | 260 | Increased strain |
| Coupling factor | 0.25 | 0.4 | 0.48 | |
| Mechanical quality factor | 175 | 1200 | 1000 | Greater bandwidth |
| Dielectric loss | 0.5 | 0.3 | 0.3 | |
| Curie point (°C) | 420 | 310 | 320 | Increased stability |
| Longitudinal velocity (m s−1) | 4175 | 3500 | 3475 |
The piezoelectric constant was measured using quasi-static meters (ZJ-3B, Institute of Acoustics, Chinese Academy of Sciences, Beijing, China). The impedance at the series resonance frequency in the thickness vibration mode of the samples was measured in air using an Agilent impedance analyzer (4294A, Keysight Technologies Inc., Santa Rosa, CA, USA), and the effective electromechanical coupling coefficient was calculated using collected resonant frequency and anti-resonant frequency , according to the following formula:25
(1)
The loss factor of the material was obtained using the following formula:
where represents impedance.
To achieve insulation between the lead-free ceramic sample and the metal transition block, the sample is subjected to depolarization treatment at a high temperature of 500 °C for 30 min. When the ceramic is used as an insulating layer, its effective Young's modulus and effective Poisson's ratio can be derived from the compliance matrix of the material and used as the numerical modeling input of COMSOL. The derivation process is as follows.26
Young's modulus is a measure of the material's stiffness, bulk modulus is an indicator of the material's compressibility, and shear modulus represents the material's shear resistance. According to linear elasticity theory, their relationship can be expressed using the following conversion equation:
Here, represents the Poisson's ratio, which indicates the degree of lateral contraction of the material during tension. The relationship between Young's modulus and shear modulus is given by the following equation:
These two expressions can be used to calculate the third parameter when any two parameters are known. Given the elastic matrix of a material, the volumetric modulus can be obtained using the following equation:
where tensor represents the components of the elastic matrix in the local coordinate system,
In anisotropic materials, the strain energy method can be employed to calculate the equivalent shear modulus. According to the method, the total strain energy of a material can be expressed using the strain tensor and the compliance matrix of an anisotropic material. For the shear strain energy component, one can focus on the shear stress-shear strain terms in the compliance matrix. For a three-dimensional material, the relevant elements in the compliance matrix are . According to the derivation of the strain energy method, the equivalent shear modulus can be calculated using the following formula:
(9)
Here, are the relevant elements in the compliance matrix.
The effective Young's modulus and Poisson's ratio can be calculated as follows:
By utilizing the aforementioned formulas, the effective Young's modulus and Poisson's ratio of the KNN-based piezoelectric ceramic sample can be determined.
From Table I, it can be observed that KNN-based piezoelectric ceramics are more advantageous for lightweight and wideband design of transducers due to their lower density (4417 kg·m−3) and lower (175) compared with PZT-8 and PZT-4. Moreover, it possesses larger piezoelectric constant (330 pC·N-1), enabling it to achieve greater strain. It is also evident that the of the KNN is significantly higher than those of the PZT-8 and PZT-4. Combined with the lower and values, it is expected that KNN-based piezoelectric ceramics are less efficient and have greater losses compared with PZT-8 and PZT-4.
During the performance tests of multiple samples of KNN-based piezoelectric ceramic bars, the numerical deviations of key parameters such as and remained within 6%. This indicates that the batches of transducers manufactured using the studied KNN-based piezoelectric ceramics can maintain a stable resonant frequency and impedance performance, which is crucial to commercial transducer manufacturing.
When the size of the transducer is much smaller than the sound wavelength, achieving low-frequency directionality becomes challenging due to sound wave diffraction. Without using dual excitation, it is difficult to excite multiple modes within a specific frequency range using a single transducer. To address this, an original transducer structure [see Fig. 1(b)] is designed in this study, which consists of a composite ring made of KNN-based lead-free piezoelectric ceramics and aluminum transition blocks, along with an aluminum cylinder with one end concave and the other end open. All of them achieve the effect of vibration coupling through the extended structure around the aluminum cylinder. In addition, attention should be paid to the space reserved for insulating layer to achieve the purpose of electrical insulation.
In this study, the modal and harmonic response analysis of the transducer is primarily conducted using the COMSOL finite element software. This analysis provides information on the resonant frequencies, admittance, and the transmitting voltage response of the transducer. By adjusting the structural parameters of the transducer, the optimal structural performance is obtained.
First, the finite element model of the transducer is shown in Figs. 2(a) and 2(b). Non-vibrating structural attachments such as flanges and polyurethane are disregarded during the modeling process. Considering the axial symmetry of the transducer [as shown in Fig. 1(b)], only a 1/24 axisymmetric model needs to be built in the COMSOL software to enhance computational efficiency, with symmetric boundary conditions applied at the symmetrical interface. A coordinate system is established during the modeling process, where the bottom end of the transducer is defined as the 180° direction, and the open end is defined as the 0° direction. This coordinate system will be consistently used throughout the following text.
FIG. 2.
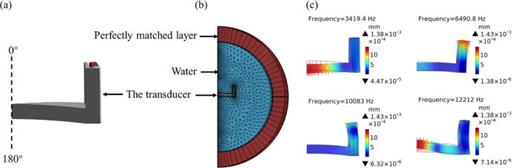
(a) A 1/24 finite element model of the transducer for modal analysis. (b) A 1/24 finite element model of the transducer for underwater harmonic response analysis. (c) The first four characteristic modes of the transducer.
FIG. 2.
(a) A 1/24 finite element model of the transducer for modal analysis. (b) A 1/24 finite element model of the transducer for underwater harmonic response analysis. (c) The first four characteristic modes of the transducer.
Close modal
Figure 2(c) illustrates the first four inherent modes of the transducer. The first mode primarily involves the bending vibration of the cylindrical base, with the lowest frequency of 3419.4 Hz. The second mode mainly consists of radial vibration of the circular ring, causing the simultaneous outward radiation of sound waves from the cylindrical base, resonating at a frequency of 6490.8 Hz. The third and fourth modes are second-order bending vibrations of the circular ring and the cylindrical base, with frequencies of 10 083 and 12 212 Hz, respectively. The nodal planes of vibration are mostly located at the junction between the cylindrical base and the bottom surface, making this region suitable for attaching a flange for underwater suspension.
As depicted in Figs. 3(a) and 3(b), the admittance of the transducer in air and water is shown. Due to the increased radiation impedance of water, the admittance curve in water appears flatter compared to that in air. Additionally, both the peak value and resonant frequency are observed to decrease in water.
FIG. 3.
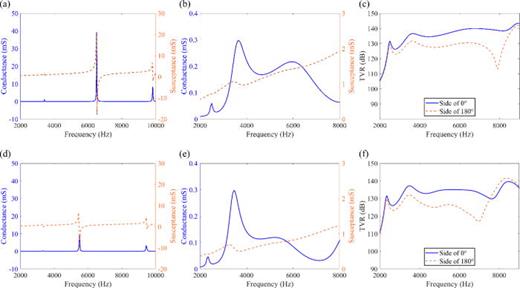
Simulated admittance of the KNN-based transducer (a) in air and (b) in water. (c) The simulated transmitting voltage response curve of the KNN-based transducer in water. Simulated admittance of the PZT-4 based transducer (d) in air and (e) in water. (f) The simulated transmitting voltage response curve of the PZT-4 based transducer in water.
FIG. 3.
Simulated admittance of the KNN-based transducer (a) in air and (b) in water. (c) The simulated transmitting voltage response curve of the KNN-based transducer in water. Simulated admittance of the PZT-4 based transducer (d) in air and (e) in water. (f) The simulated transmitting voltage response curve of the PZT-4 based transducer in water.
Close modal
The axial pressure response of the circular ring is extracted, and the transmitting voltage response (TVR) curve is plotted as shown in Fig. 3(c). It clearly shows a difference in TVR between the open end (side of 0°) and the bottom end (side of 180°) of the transducer. This is because the transducer is asymmetric in the axial direction, and the directional sound field can be realized through its own multi-modal coupling vibration mechanism. The first four resonant frequencies are 2550, 3700, 6800, and 9000 Hz. The maximum voltage response at the side of 0° can reach 143 dB, and the response fluctuates within ±3 dB in the frequency range of 3400–8700 Hz, indicating that the transducer has a wideband transmission capability exceeding one octave. By comparing the transmitting voltage response curves of the transducer's axial front and rear sides, it can be observed that the two curves show similar trends throughout the frequency range under study. This indicates good consistency in the axial radiation of the transducer. Within the wideband range of 3900–8550 Hz, a front-to-back sound pressure ratio exceeding 6 dB can be achieved, and at certain frequencies, the front-to-back sound pressure ratio can reach approximately 20 dB. These results meet the design requirements for a low-frequency directional wideband transducer.
Figures 3(d)–3(f) compare the impedance characteristics in both air and water as well as the voltage response curves in water, between KNN-based lead-free piezoelectric transducers and PZT-4 based transducers of the same structural dimensions. In contrast to the PZT-4 based transducer, the KNN-based transducer exhibits varying degrees of increased resonance frequencies across all orders in air and water. It also displays higher admittance values and TVR compared to the PZT-4 based transducer. Notably, the most significant enhancement appears in the response of the third-order resonance, resulting in a wider bandwidth. These comparisons align with the characteristics of KNN, characterized by lower density, higher , and lower .
Based on the design results mentioned earlier, a prototype of the transducer was fabricated, and the flow chart of its fabrication is shown in Fig. 4. The transducer weighs 4.45 kg in air, and the maximum dimensions after packaging are Φ236 × 83 mm2. Compared with a lead-based piezoelectric ceramic transducer with the same structural dimensions, the weight can be reduced by approximately 25.6% through using KNN.
FIG. 4.
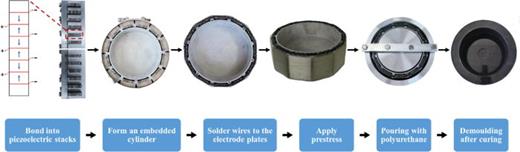
Manufacturing process flow chart of the transducer.
FIG. 4.
Manufacturing process flow chart of the transducer.
Close modal
The assembled transducer was placed an anechoic tank for testing. The anechoic tank is 50 m long, 15 m wide, and 10 m deep. The transducer and hydrophone are placed at a depth of 4 m with 4 m between the two. The connection method is shown in Fig. 5(a). The bottom (180° direction) and open end (0° direction) of the transducer face the SPH32R-110 hydrophone (Institute of Acoustics, Chinese Academy of Sciences, Beijing, China). An Agilent 33500B signal generator (Agilent Technologies Inc., Santa Clara, CA) is then used to excite the transducer through a S11-8LF power amplifier (Instruments Inc., San Diego, CA) with a sinusoidal signal of 2–9 kHz. The calibrated hydrophone receives the far-field radiation pressure, p(r). The received signal is amplified by the NF3625 measurement amplifier (NF corporation, Japan). Using an Agilent oscilloscope (Agilent Technologies Inc., Santa Clara, CA) to display the input and received signals in the time domain, the TVR can be calculated using the following equation:27
FIG. 5.
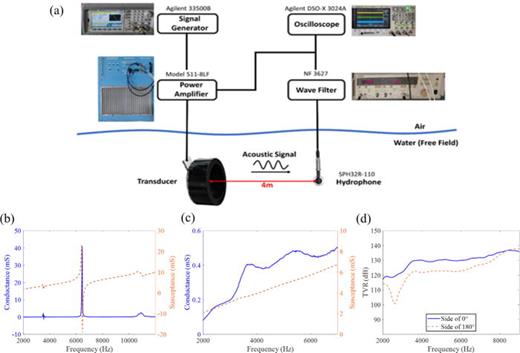
(a) Block diagram of the device and testing setup. Measured admittance of the transducer (b) in air and (c) in water. (d) The measured transmitting voltage response curve of the transducer in water.
FIG. 5.
(a) Block diagram of the device and testing setup. Measured admittance of the transducer (b) in air and (c) in water. (d) The measured transmitting voltage response curve of the transducer in water.
Close modal
The impedance curves in Fig. 5(b) represent the transducer's response in air, while the impedance curves in Fig. 5(c) represent its response in water. The electrical impedance measurements are taken on all samples connected in parallel, and the vibrations of ceramics and metal cylinder are coupled with each other. Therefore, they represent the dynamic impedances of the whole transducer. A comparison between the experimental results and simulation findings is presented in Tables II and III. The resonant frequencies of the transducer obtained from simulations and experimental measurements show good agreement. Specifically, the deviations between simulated and measured frequencies for the first two resonant modes are around 2%, while the deviation for the third resonant mode is around 10%. This aligns with the rule that higher-order resonances tend to have larger errors. This is because the higher-order vibrations of the transducer involve more complex vibration modes, which are more sensitive to factors such as environmental damping, manufacturing processes, and numerical approximations in finite element methods. Moreover, the measured resonant frequencies in water tend to be lower than the simulated values, which can be attributed to the influence of the polyurethane encapsulation. The conductance values of the transducer obtained from simulations and measurements remain within the same order of magnitude, with slightly larger measurement deviation in water compared to that in air. This difference is primarily attributed to the variations in boundary conditions between the measurements in air and water. In the air measurement, the transducer operates under free boundary conditions. However, in the water measurement, the suspended apparatus alters the boundary conditions of the transducer. It is also challenging to achieve perfect consistency in the damping conditions between simulations and experiments, which is also an important contributor to the deviation.
TABLE II.
The comparison between the simulated and measured results of the transducer's impedance in air.
| Resonant frequency (kHz) | Maximum conductance (mS) | |||||
|---|---|---|---|---|---|---|
| Simulation | 3.42 | 6.51 | 9.82 | 1.23 | 39.17 | 8.15 |
| Measurement | 3.51 | 6.56 | 10.92 | 2.20 | 40.71 | 2.59 |
| Resonant frequency (kHz) | Maximum conductance (mS) | |||||
|---|---|---|---|---|---|---|
| Simulation | 3.42 | 6.51 | 9.82 | 1.23 | 39.17 | 8.15 |
| Measurement | 3.51 | 6.56 | 10.92 | 2.20 | 40.71 | 2.59 |
TABLE III.
The comparison between the simulated and measured results of the transducer's impedance in water.
| Resonant frequency (kHz) | Maximum conductance (mS) | |||||
|---|---|---|---|---|---|---|
| Simulation | 2.50 | 3.65 | 6.00 | 0.71 | 0.30 | 0.22 |
| Measurement | 2.50 | 3.62 | 5.50 | 0.16 | 0.40 | 0.49 |
| Resonant frequency (kHz) | Maximum conductance (mS) | |||||
|---|---|---|---|---|---|---|
| Simulation | 2.50 | 3.65 | 6.00 | 0.71 | 0.30 | 0.22 |
| Measurement | 2.50 | 3.62 | 5.50 | 0.16 | 0.40 | 0.49 |
Figure 5(d) illustrates the transmitting voltage response curves of the transducer in water. From the maximum response value minus 6 dB in the solid line, the corresponding frequency range from 3500 to 8200 Hz is the bandwidth range of -6dB within the operating frequency range of the transducer. It achieves directional emission with a maximum front-to-back sound pressure ratio of 18 dB at a low frequency of 2.5 kHz. The measured results closely match the simulated calculations, validating the feasibility of the proposed research approach.
In summary, this study presents the application of large-sized lead-free KNN-based lead-free piezoelectric ceramic bars (75 × 9× 5.5 mm3) in low-frequency (<10 kHz) directional wideband underwater acoustic transducers. Comparative analysis revealed that this material exhibits lower density, higher piezoelectric constants, and lower values compared with traditional PZT materials. These characteristics align with the desired properties for low-frequency wideband underwater acoustic transducers. Based on this material, an innovative structured underwater acoustic transducer was designed in this study. This structure combines an asymmetric metal cylinder with the traditional embedded ring design and utilizes multi-modal coupling to achieve a −6 dB wideband emission from 3500 to 8200 Hz. Moreover, the transducer achieves a low-frequency directional emission with a front-to-back sound pressure ratio greater than 6 dB. The proposed design reduced mass when contrasted with conventional baffle structures or oil-filled configurations frequently employed in low-frequency directional transducers. Furthermore, it offers a streamlined alternative to the intricate modal excitation techniques employed in multi-circuit systems. This transducer effectively capitalizes on the advantages of KNN-based lead-free piezoelectric ceramics to achieve a lightweight design with a mass reduction of 25.6%. Additionally, it harnesses the benefits of a liquid-filled cavity to augment its pressure resistance, particularly pertinent in deep-water environments. Theoretical analyses and experimental results both demonstrate the promising prospects of using KNN-based lead-free piezoelectric ceramics in low-frequency wideband underwater acoustic transducers.
SUPPLEMENTARY MATERIAL
See the supplementary material for the details of the transducer fabrication process, stability studies, and parameter testing of KNN-based lead-free piezoelectric ceramic materials.
This work was supported in part by the National Nature Science Foundation of China under Grant Nos. 52032005 and 62127801 and by the Beijing Municipal Natural Science Foundation under Grant No. JQ20009.
AUTHOR DECLARATIONS
Conflict of Interest
The authors have no conflicts to disclose.
Author Contributions
Xiuzhen Zhang: Conceptualization (equal); Data curation (equal); Formal analysis (equal); Methodology (equal); Software (equal); Validation (equal); Visualization (equal); Writing – original draft (equal); Writing – review & editing (equal). Chaofeng Wu: Project administration (equal); Resources (equal). Wen Gong: Project administration (equal); Resources (equal). Ke Wang: Funding acquisition (equal); Supervision (equal); Writing – review & editing (equal). Xiping Mo: Funding acquisition (equal); Supervision (equal). Yong Chai: Conceptualization (equal); Supervision (equal); Writing – review & editing (equal).
DATA AVAILABILITY
The data that support the findings of this study are available from the corresponding author upon reasonable request.
REFERENCES
1. X. Mo , Bull. Chin. Acad. Sci. 34 (3), 272 (2019).
2. J. Wu , J. Sichuan Normal Univ. (Nat. Sci.) 42 (2),
143
(
2019
).
3.
X.
Peng
,Y.
Tang
,B.
Zhang
,L.
Zhu
,B.
Xun
, andJ.
Yu
,J. Appl. Phys.
130
(
14
),
144104
(
2021
).
4.
J.
Zhang
,Z.
Pan
,F. F.
Guo
,W. C.
Liu
, andY. F.
Chen
,Nat. Commun.
6
,
6615
(
2015
).
5.
Y.
Wu
,Y.
Cheng
,S.
Guan
,X.
Waang
,W.
Shi
,H.
Xu
,R.
Lang
,J.
J.
Zhu
, andQ.
Chen
,Inorg. Chem.
62
(
37
),
15094
(
2023
).
6.
K.
Wang
andJ.-F.
Li
,J. Adv. Ceram.
1
(
1
),
24
(
2012
).
7.
J. F.
Li
,K.
Wang
,F. Y.
Zhu
,L. Q.
Cheng
, andF. Z.
Yao
,J. Am. Ceram. Soc.
96
(
12
),
3677
(
2013
).
8.
J.
Z.
Tan
,L.
Jiang
,Q.
Chen
,J.
Wu
,W.
Zhang
,D.
Xiao
, andJ.
Zhu
,J. Appl. Phys.
119
(
3
),
034101
(
2016
).
9.
H. C.
Thong
,C.
Zhao
,Z.
Zhou
,C.-F.
Wu
,Y.-X.
Liu
,Z.-Z.
Du
,J.-F.
Li
,W.
Gong
, andK.
Wang
,Mater. Today
29
,
37
(
2019
).
10.
S.
Kim
,G. P.
Khanal
,H.-W.
Nam
,I.
Fujii
,S.
Ueno
,C.
Moriyoshi
,Y.
Kuroiwa
, andS.
Wada
,J. Appl. Phys.
122
(
16
),
164105
(
2017
).
11.
J.
Wu
,J. Appl. Phys.
127
(
19
),
190901
(
2020
).
12.
D. W.
Wu
,R. M.
Chen
,Q. F.
Zhou
,K. K.
Shung
, andH. L. W.
Chan
,Ultrasonics
49
(
3
),
395
(
2008
).
13.
G.
Feuillard
,V.
Loyau
,L. P. T. H.
Hue
,T.
Wurlitzer
, andM.
Lethiecq
,paper presented at the IEEE Symposium on Ultrasonics
,
2003
.
14.
Y.
Chen
,X.
Jiang
,H.
Luo
,J.
Dai
, andH. L. W.
Chan
,IEEE Trans. Ultrason., Ferroelectr., Freq. Control
57
(
11
),
2601
(
2010
).
15.
J.
Zhu
,Q.
Chen
,D.
Xiao
,L.
Chen
, andP.
Yu
, China Patent No. CN1919791 (12 September2006
).
16.
X. X.
Wang
,S. W.
Or
,K. H.
Lam
,H. L. W.
Chan
,P. K.
Choy
, andP. C. K.
Liu
,J. Electroceram.
16
(
4
),
385
(
2006
).
17.
M. S.
Kim
,S.
Jeon
,D. S.
Lee
,S. J.
Jeong
, andJ. S.
Song
,J. Electroceram.
23
(
2–4
),
372
(
2009
).
18.
X.
Zhang
,C.
Wu
,F.
Yao
,K.
Wang
, andY.
Chai
,J. Appl. Acoust.
42
(
4
),
674
(
2023
).
19.
W.
Lu
andY.
Lan
,J. Shaanxi Normal Univ. (Nat. Sci.)
38
(
5
),
23
(
2010
).
20.
J.
Zhang
,A. C.
Hladky-Hennion
,W. J.
Hughes
, andR. E.
Newnham
,Ultrasonics
39
(
2
),
91
(
2001
).
21.
J.
Zhang
andR. E.
Newnham
, U.S. Patent No. US6614143(B2) (2 September2003
).
22.
K. P. B.
Moosad
,G.
Chandrashekar
,M. J.
Joseph
, andR.
John
,Appl. Acoust.
72
(
2–3
),
127
(
2011
).
23.
F.
Yao
,C.
Wu
,J.
Li
,W.
Gong
, andK.
Wang
,J. Chin. Ceram. Soc.
50
(
03
),
587
(
2022
).
25.
T.
Tetsuro
,J.
Chen
, andY.
Wang
,Piezoelectric Ceramic Materials
(
Science Press
,
Beijing
,
1982
).
26.
Y.
Jiang
,J.
Zhang
, andZ.
Li
,Elasticity Mechanics and Finite Element Method
(
Science Press
,
Beijing
,
2006
).
27.
F.
Jacobsen
,Fundamentals of General Linear Acoustics
(
John Wiley & Sons
,
2013
).
© 2024 Author(s). Published under an exclusive license by AIP Publishing.
2024
Author(s)
Supplementary Material


No comments:
Post a Comment