
Enhancing UAV Security Through Zero Trust Architecture: An Advanced Deep Learning and Explainable AI Analysis
Summary
Artifacts
Computer Science > Machine Learning
In the dynamic and ever-changing domain of Unmanned Aerial Vehicles (UAVs), the utmost importance lies in guaranteeing resilient and lucid security measures. This study highlights the necessity of implementing a Zero Trust Architecture (ZTA) to enhance the security of unmanned aerial vehicles (UAVs), hence departing from conventional perimeter defences that may expose vulnerabilities. The Zero Trust Architecture (ZTA) paradigm requires a rigorous and continuous process of authenticating all network entities and communications.
The accuracy of our methodology in detecting and identifying unmanned aerial vehicles (UAVs) is 84.59\%. This is achieved by utilizing Radio Frequency (RF) signals within a Deep Learning framework, a unique method. Precise identification is crucial in Zero Trust Architecture (ZTA), as it determines network access. In addition, the use of eXplainable Artificial Intelligence (XAI) tools such as SHapley Additive exPlanations (SHAP) and Local Interpretable Model-agnostic Explanations (LIME) contributes to the improvement of the model's transparency and interpretability. Adherence to Zero Trust Architecture (ZTA) standards guarantees that the classifications of unmanned aerial vehicles (UAVs) are verifiable and comprehensible, enhancing security within the UAV field.
Submission history
From: Ekramul Haque [view email][v1] Mon, 25 Mar 2024 18:32:22 UTC (1,221 KB)
Enhancing UAV Security Through Zero Trust Architecture: An Advanced Deep Learning and Explainable AI Analysis
Abstract
In the dynamic and ever-changing domain of Unmanned Aerial Vehicles (UAVs), the utmost importance lies in guaranteeing resilient and lucid security measures. This study highlights the necessity of implementing a Zero Trust Architecture (ZTA) to enhance the security of unmanned aerial vehicles (UAVs), hence departing from conventional perimeter defences that may expose vulnerabilities. The Zero Trust Architecture (ZTA) paradigm requires a rigorous and continuous process of authenticating all network entities and communications. The accuracy of our methodology in detecting and identifying unmanned aerial vehicles (UAVs) is 84.59%. This is achieved by utilizing Radio Frequency (RF) signals within a Deep Learning framework, a unique method. Precise identification is crucial in Zero Trust Architecture (ZTA), as it determines network access. In addition, the use of eXplainable Artificial Intelligence (XAI) tools such as SHapley Additive exPlanations (SHAP) and Local Interpretable Model-agnostic Explanations (LIME) contributes to the improvement of the model’s transparency and interpretability. Adherence to Zero Trust Architecture (ZTA) standards guarantees that the classifications of unmanned aerial vehicles (UAVs) are verifiable and comprehensible, enhancing security within the UAV field.
Index Terms:
Zero Trust Architecture, Drone Detection, RF Signals, Deep Learning, SHAP, LIME, Explainable AI, Airspace SecurityI Introduction
Commercial drones, also known as Unmanned Aerial Vehicles (UAVs), are now widely used in several fields, such as delivery services, agriculture, surveillance, and emergency response [1, 2, 3, 4]. This is owing to their versatile applications in the quickly changing environment of unmanned aerial systems. Nevertheless, the extensive implementation of this technology has brought about intricate security obstacles, especially in areas that require heightened caution. The significance of tackling these difficulties has been emphasized by recent instances, as seen in the increased attention given to UAV security measures by the U.S. Army and other international institutions[5].
The concept of Zero Trust Architecture (ZTA)[6] is a revolutionary way to address the growing security risks posed by unmanned aerial vehicles (UAVs). ZTA substantially reconceptualizes conventional security models by promoting a constant and thorough verification of all entities inside a network environment, eliminating implicit trust. This transition is vital within the realm of UAV operations, where the ever-changing and frequently unforeseeable characteristics of flight paths and interactions require a security framework that is more robust and flexible.
Although there is a clear need for it, the use of ZTA (Zero Trust Architecture) in UAV (Unmanned Aerial Vehicle) security is still in its early stages. One particular problem is establishing continuous authentication mechanisms that can keep up with the changing operational dynamics of UAVs. Traditional security tactics frequently prove insufficient, either due to their lack of flexibility or failure to effectively handle the full range of possible dangers posed by UAVs.
The objective of our research is to close this divide by suggesting a sophisticated combination of Deep Learning (DL) and Explainable Artificial Intelligence (XAI) within the ZTA framework for UAV security. The purpose of this integration is to improve both the precision of UAV identification and the level of transparency and accountability in AI-driven decision-making. This is crucial for establishing confidence in security applications[7].
Prior studies have investigated the identification and categorization of UAVs using diverse methodologies. For instance, Kim et al.[8] and Choi and Oh[9] showcased the utilization of Convolutional Neural Networks (CNNs) with Doppler and micro-doppler images to classify UAVs. Similarly, other researchers have employed deep belief networks and CNNs to analyze surveillance images[10] and audio spectrograms[11]. However, these researches have mostly concentrated on the detection component without completely incorporating their methods into a broader security framework such as Zero Trust Architecture (ZTA).
Our technology utilizes Radio Frequency (RF) signals in a DL framework, resulting in an accuracy 84.59% in differentiating UAV signals from RF noise. Importantly, we broaden the utilization of SHapley Additive exPlanations (SHAP)[12] and Local Interpretable Model-agnostic Explanations (LIME)[13] beyond their typical application. These Explainable Artificial Intelligence (XAI) technologies not only improve the precision of our UAV detection model but also offer a crucial level of interpretability and transparency, allowing stakeholders to comprehend and have confidence in the judgments made by the AI system.
To summarise, this article greatly enhances the field of UAV security by creatively integrating Zero Trust Architecture (ZTA), Deep Learning (DL), and Explainable Artificial Intelligence (XAI)[14]. Our methodology tackles the technological and trust-related obstacles in UAV security, facilitating the implementation of stronger and more transparent security protocols in an airspace that is becoming increasingly occupied with drones.
The remainder of this paper is organized as follows: Section II describes the System Architecture; Section III presents the results from tests conducted by the framework where the proposed architecture was evaluated. Finally, Section IV briefly discusses future enhancements and concluding remarks.
II System Architecture
II-A Zero Trust Architecture Framework Description
In this section, we present the details of our continuous authentication scheme under a zero-trust security framework.
The conventional method of authentication involves validating the legality of an entity at the commencement of a session, hence exposing it to potential security breaches such as hijacking. As suggested in this proposal, continuous authentication involves the ongoing verification of the connecting node’s identity during a session. This approach aims to supplement the existing static method rather than replace it entirely.

Within this framework, a continuous authentication mechanism is employed to guarantee the security of Unmanned Aerial Vehicles (UAVs). Figure 1 illustrates the workflow of the continuous authentication technique. The procedure above is iteratively conducted at regular intervals of 10 seconds, as determined through empirical observation and analysis. The data features are extracted from the input data. The classifier is trained using the entire dataset. A safe ZTA framework for UAVs starts with determining the type of UAV in use. Our DNN model classifies UAVs by RF signals, distinguishing brands and types. This classification requires a baseline understanding of the UAV’s properties and predicted behavior. Classification is a necessary but basic stage in authentication. Correctly recognizing the UAV type allows the system to apply relevant security policies and permissions.
Now, we will delve into our DNN classifier architecture. Figure 2 presents the architecture, an AI-driven framework for UAV classification. It integrates PCA, drones, LIME, and SHAP to enhance the DL model’s credibility using explainable ML tools.
The process begins by preparing RF data, converting it from time to frequency domain using DFT. The frequency components act as inputs, with power spectra as critical features, forming the basis for DNN training.
To address dataset complexity, PCA reduces dimensionality, streamlining computational needs and removing redundancy. The refined dataset then trains the DNN model to classify drones into four categories.
For transparency, we employ XAI techniques, specifically SHAP and LIME, ensuring transparent decision-making and boosting user trust in model classifications.
II-B Analysis of the Data set
We used the vastly popular DroneRF dataset[15], which contains captured RF signals from drones of three kinds. Segmenting and storing the DroneRF dataset in CSV format prevents memory overflow and ensures program compatibility. The model divides drones into four categories based on data from three brands and the lack of drones.
The main problem was translating time-domain data to frequency domain for better analysis. Achieved this conversion using the DFT. Our deep learning model relies on power spectra, particularly frequency components, as its fundamental properties.
II-C Data Preprocessing
Each archived RF segment signal is transformed using the MATLAB Fast Fourier Transform (FFT) function with 2048 frequency divisions (M = 2048). The frequency-domain RF signals are represented by equations 1 & 2 as[1]:
| (1) |
| (2) |
where denotes the RF segment , coming from the first RF receiver that captures the lower half of the RF spectrum, is the th RF segment coming from the second RF receiver that captures the upper half of the RF spectrum, and are the spectra of the th segments coming from the first and second RF receivers respectively, and are the time and frequency domain indices, is the total number of time samples in the RF segment , and is the magnitude operator used to compute the power spectrum. Note that and contain only the positive spectra of and to guarantee non-redundant and concise spectral projections. Then, we combine the transformed signals of both receivers to create the entire RF spectrum by equations 3 & 4, as follows:
| (3) |
and
| (4) |
where is a normalization factor calculated as the ratio between the last samples of the lower spectra, , and the first samples of the upper spectra, , and is the total number of frequency bins in . The normalization factor, , ensures spectral continuity between the two halves of the RF spectrum as they were captured using different devices; hence, a spectral bias is inevitable. Note that must be relatively small to successfully stitch the two spectra and be large enough to average out any random fluctuations, e.g. = 10 for = 2048.
II-D Model Architecture
The proposed model can detect drones and differentiate among the RF spectra of distinct drones. A DNN comprises an input layer, different hidden layers, and an output layer.
Using the following expressions[16], one can articulate the input-output relationship of a DNN by equations 5 & 6:
| (5) |
| (6) |
where i is the output of layer -1 and the input to layer ; is the output of layer and the input to layer + 1; = is the spectrum of the RF segment ; = is the classification vector for the RF segment ; is the weight matrix of layer ; is the weight between the th neuron of layer and the th neuron of layer - 1; = , , …. is the bias vector of layer ; f () is the activation function of layer ; = 1, 2, . . . , ; - 1 is the total number of hidden layers; is the total number of neurons in layer ; ; ; and is the number of classes in the classification vector, [16]. Note that can be any linear or nonlinear function; however, the rectified linear unit (ReLU) and the softmax functions, expressed in 7 and 8 respectively, are typical choices that have demonstrated promising results.
| (7) |
| (8) |
The DNN’s weights and biases are determined by a supervised learning method that minimizes classification error. The minimization is carried out by a gradient descent algorithm, which calculates the gradient by backpropagation. The classification error of the system is represented by the categorical cross-entropy error in equation 9:
| (9) |
where is the total number of samples, is the true label for class of the ith sample, often one-hot encoded, is the predicted probability for class of the ith sample, denotes the sum over samples, denotes the sum of classes.
In this study, a DNN is trained and evaluated using the developed RF database to detect the presence of a drone and determine its class.
II-E Generating Explanations
SHAP calculates the contribution of each feature to the model’s prediction. The consequence of every potential combination of characteristics is analyzed to determine the feature relevance. If features exist, SHAP creates unique prediction models. The dataset is the same in all models; the only difference is the number of features evaluated. The difference between these models’ predictions will aid in calculating the overall relevance of the characteristic. Here’s how SHAP values are calculated. For an arbitrary model and instance, the SHAP value for a feature is given by equation II-E like [12]:
| (10) |
where is the prediction model, is the set of all features, and is a subset of , not containing feature . represents the union of sets. is the size of set . The sum over all subsets of does not contain feature .
LIME provides localized interpretations of classifier predictions. Starting with an instance, , it generates a perturbed dataset around , predicts probabilities for each instance using the original model, and assigns weights based on proximity to . An interpretable model, like linear regression, is then fitted to this dataset, approximating the original model’s behavior near .
Given as the interpretable model, as the complex model, and as a complexity measure, LIME optimizes:
| (11) |
where measures proximity between and samples . The objective is a simple model with minimized prediction loss.
III Experimental Analysis
III-A Principal Component Analysis
The tests preserved 95% of the variation in the baseline dataset. We chose this solution to strike a balance between processing efficiency and data integrity. Initial trials indicated that retaining variance was an acceptable trade-off, preserving important training properties while reducing processing needs.
|
|
||||
|---|---|---|---|---|---|
| Without PCA[1] | 2047 | 77.2 | |||
| With PCA | 688 | 51.6 |
From Table I, we can see that using PCA, we reduced the number of features to 688 while maintaining 95 % of the original data’s variance, which made the algorithm significantly faster.
III-B Experimental Result
In this experiment, the DNN is trained by an Adam optimizer to minimize the categorical cross-entropy of classification using the following parameters: 3 hidden fully-connected layers (, 256, 128 and 64 total number of neurons at the first, second and third hidden layers respectively = 256, = 128, = 64), 200 total epochs, 10 batch size, is the ReLU function for the hidden layers and the softmax function for the output layer. Each network’s classification performance is validated utilizing a stratified 10-fold cross-validation procedure (K = 10). It is to be mentioned here that, in their work on UAV detection[17], M.F. Al-Sa’d et al. used mse for loss and sigmoid function for the output layer. However, we used categorical cross-entropy as a loss function and softmax function for the output layer. As a result, even after using PCA, we got better accuracy. Table II shows the complete evaluation results’ comparison for the DNN models based on accuracy, precision, recall, and F1 score.
|
|
|
|
|||||||||
|---|---|---|---|---|---|---|---|---|---|---|---|---|
| Without PCA[17] | 84.50 | 92.02 | 76.96 | 79.45 | ||||||||
| With PCA | 84.59 | 90.32 | 78.39 | 81.02 |
The table reveals that we have improved in every metric except for precision.
III-C Deep Neural Network Performance: Confusion Matrix Analysis
Figure 3 represents a confusion matrix that shows the performance of the DNN that classifies the drones through the test dataset. The matrix demonstrates the model’s capability to predict the class of drones accurately. The model correctly predicted No Drone cases 4085 times, Bebop Drones 8241 times, AR Drones 6000 times, and Phantom Drones 877 times.

III-D Interpreting Predictions with SHAP
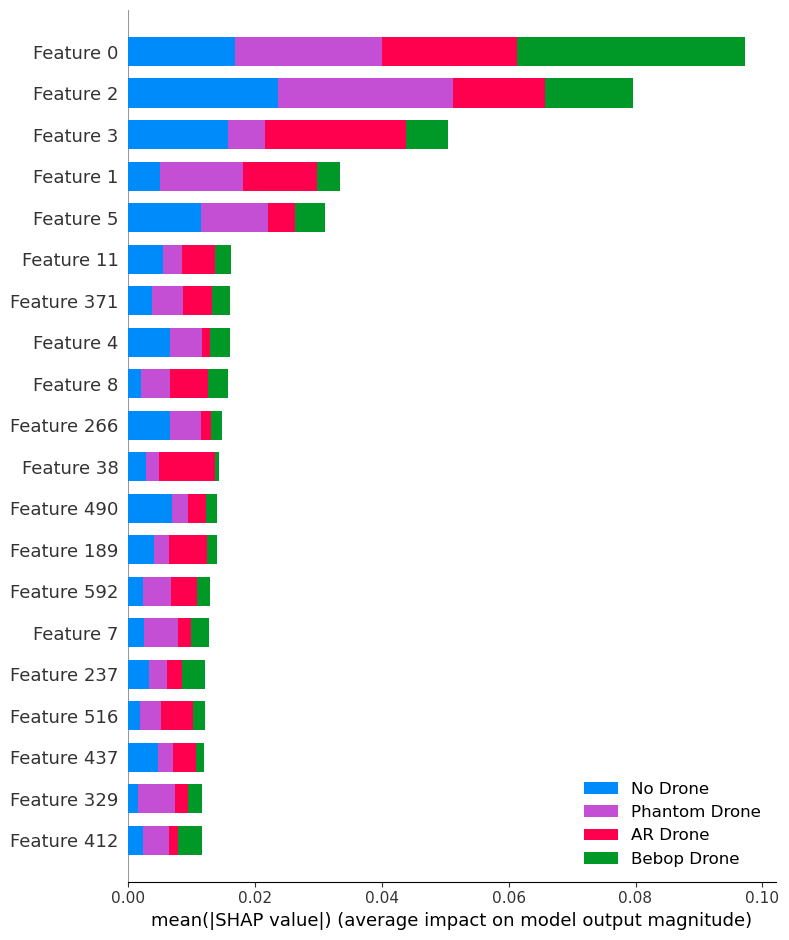
The SHAP summary plot is a global explanation of a model that incorporates the importance and effect of features. The features are on the axis, and the axis represents the values. The use of colours indicates different drones. A summary plot shows random features and their contributions toward 4 classes as bars. Figure 4 shows that feature 0 contributes most to Bebop Drone. Similarly, feature 2 has the most influence over the Phantom Drone.
III-E Interpreting Predictions with LIME
LIME produces regional explanations. Figure 5 illustrates how to determine whether a classification result is No Drone, Bebop, AR’ or Phantom, along with the probability and original instance values. Here, we showed two instances. The instances are shown Bebop and NOT Bebop because the classifier finds it most crucial to decide whether the instances are Bebop or not. Colors are used to indicate the class a character belongs to. While orange attributes contribute to the Bebop category, blue features contribute to the Not Bebop category.

We can see distinct characteristics justify different classifications. In instance 2624, Features 2 and 3 contribute to the prediction that there is no drone, whereas in instance 19701, features 1 and 37 contribute to the prediction that there is an AR Drone.
Conclusion
The training dataset limits our current model’s ability to classify UAVs based on RF signals. The dataset only includes RF signals from three drone kinds, limiting the model’s capacity to generalize to new drone types. When encountering a drone not in the training dataset, our machine may misclassify, assign it to a known category, or lose confidence in its predictions. This limitation is significant since real-world deployment of such a system will face more UAV kinds. We must overcome this constraint to improve the model’s utility and resilience. We recommend adding an anomaly detection algorithm to our future work to overcome this constraint and make our model more applicable in varied operational situations. First, this algorithm would identify when the model encounters a drone type that significantly deviates from the known categories, and second, it would flag these instances for manual review or classify them as ’unknown’. Such an approach would improve the model’s accuracy in known scenarios and allow it to adapt to new conditions, increasing its real-world applicability. Future studies will expand the dataset to include more drone kinds. The model will learn more RF signal characteristics with this increase, enhancing classification accuracy and generalizability. An anomaly detection component and a richer, more varied dataset will improve our Zero Trust Architecture UAV security model.”
References
[1] M. F. Al-Sa’d, A. Al-Ali, A. Mohamed, T. Khattab, and A. Erbad, “Rf-based drone detection and identification using deep learning approaches: An initiative towards a large open source drone database,” Future Generation Computer Systems, vol. 100, pp. 86–97, 2019.
xxxxxxx
RF-based drone detection and identification using deep learning approaches: An initiative towards a large open source drone database
Get rights and content
Referred to by
Data in Brief, Volume 26, October 2019, Pages 104313
Highlights
RF-based drone detection is one of the most effective methods for drone detection.
Collect, analyze, and record RF signals of different drones under different flight statuses.
Design of three deep learning networks to detect and identify intruding drones.
The developed RF database along with our implementations are publicly available.
Abstract
The omnipresence of unmanned aerial vehicles, or drones, among civilians can lead to technical, security, and public safety issues that need to be addressed, regulated and prevented. Security agencies are in continuous search for technologies and intelligent systems that are capable of detecting drones. Unfortunately, breakthroughs in relevant technologies are hindered by the lack of open source databases for drone’s Radio Frequency (RF) signals, which are remotely sensed and stored to enable developing the most effective way for detecting and identifying these drones.
This paper presents a stepping stone initiative towards the goal of building a database for the RF signals of various drones under different flight modes. We systematically collect, analyze, and record raw RF signals of different drones under different flight modes such as: off, on and connected, hovering, flying, and video recording. In addition, we design intelligent algorithms to detect and identify intruding drones using the developed RF database. Three deep neural networks (DNN) are used to detect the presence of a drone, the presence of a drone and its type, and lastly, the presence of a drone, its type, and flight mode.
Performance of each DNN is validated through a 10-fold cross-validation process and evaluated using various metrics. Classification results show a general decline in performance when increasing the number of classes. Averaged accuracy has decreased from 99.7% for the first DNN (2-classes), to 84.5% for the second DNN (4-classes), and lastly, to 46.8% for the third DNN (10-classes). Nevertheless, results of the designed methods confirm the feasibility of the developed drone RF database to be used for detection and identification. The developed drone RF database along with our implementations are made publicly available for students and researchers alike.
Introduction
Commercial unmanned aerial vehicles, or drones, are gaining great popularity over the recent years, thanks to their lower cost, smaller size, lighter weight, higher capabilities, and advancements in batteries and motors. This has rendered drones viable for various applications, such as
- traffic monitoring [1], [2],
- weather observation [3],
- disaster management [4],
- spraying of agricultural chemicals [5],
- inspection of infrastructures [6], and
- fire detection and protection [7].
Drones are remotely controlled using wireless technologies such as Bluetooth, 4G and WiFi; hence, by using off-the-shelf upgrades, drones have become a modular solution. The ubiquitous utility of drones can lead to technical, security, and public safety issues that need to be addressed, regulated and prevented, e.g. spying, transfer of illegal or dangerous goods, disturbing electricity and telephone lines, and assault [8]. Therefore, regulating entities need technologies that are capable of detecting and identifying drones without prior assumption on their type or flight mode.
Conventional methods for detecting and identifying intruding drones, e.g. radars, vision and acoustics, are not solely reliable as they can be easily restrained [9], [10]. Radio frequency (RF) sensing combined with deep learning approaches promised a solution; however, it was hindered by the lack of databases for the RF signals of drones [11]. In this paper, we (1) build a novel open source database for the RF signals of various drones under different flight modes, and (2) test the developed database in a drone detection and identification system designed using deep neural networks. This work is a stepping stone towards a larger database built by a community of researchers to encompass the RF signals of many other drones.
The rest of the paper is organized as follows: Section 2 is an overview of related work. We present in Section 3 the system model and describe our methodologies to build and test the database. In Section 4, we present and discuss results of the drone detection and identification system, and finally, we conclude in Section 5.
Section snippets
Related work
In this Section, we review current anti-drone systems and discuss the need for open source drone databases. Moreover, we review state-of-the-art methods used to detect and identify intruding drones and discuss their applicability in real-life scenarios. Finally, we review the role of deep learning techniques in anti-drone systems and discuss their feasibility to test the developed RF database.
Anti-drone systems: several commercial and military anti-drone systems have been discussed in the
Methodology
In this Section, we present the system model that is used to build up the drone RF database and to test its feasibility in a drone detection and identification system. First, we discuss the subsystems and components of the model and summarize their requirements and roles. After that, we elaborate on the discussion for each component and present the experimental setup to build the drone RF database. Finally, we design a drone detection and identification system using DNNs to test the feasibility
Results and discussions
In this Section, we first present the experimental settings and preprocessing utilized in this work to develop the drone RF database and the RF-based drone detection and identification system. After that, we present snippets from the developed RF database and analyze its spectral information for different drones under different flight modes. Finally, we present and discuss results of the RF-based drone detection and identification system.
Conclusions
As drones are becoming more popular among civilians, regulating entities demand intelligent systems that are capable of detecting and identifying intruding drones. However, the design of such systems is hindered by the lack of large labeled open source databases. This work is a contribution towards this goal by developing a database of drones Radio Frequency (RF) communications that can be further extended by researchers and students. The developed database encompasses RF signals of various
Acknowledgments
This publication was supported by Qatar university Internal Grant No. QUCP-CENG-2018/2019-1. The work of Aiman Erbad is supported by grant number NPRP 7-1469-1-273. The findings achieved herein are solely the responsibility of the authors.
Declaration of competing interest
No author associated with this paper has disclosed any potential or pertinent conflicts which may be perceived to have impending conflict with this work.
Mohammad Fathi Al-Sa’d received his B.Sc. and M.Sc. degrees in Electrical Engineering from Qatar University, Qatar, in 2012 and 2016 respectively. He specialized in signal processing and graduated with honors under professor Boualem Boashash supervision. He worked as a Research Assistant at Qatar University, and currently he is a Researcher and a Doctoral student at Laboratory of Signal Processing, Tampere University of Technology, Finland. He has served as a technical reviewer for several
References (69)
- Dynamic UAV-based traffic monitoring under uncertainty as a stochastic arc-inventory routing policy Int. J. Transp. Sci. Technol. (2016)
- SaiedA. et al. Detection of known and unknown DDoS attacks using artificial neural networks Neurocomputing (2016)
- WangJ. et al. Stochastic switched sampled-data control for synchronization of delayed chaotic neural networks with packet dropout Appl. Math. Comput. (2018)
- ShiK. et al. New reliable nonuniform sampling control for uncertain chaotic neural networks under Markov switching topologies Appl. Math. Comput. (2019)
- ZengX. et al. Distribution-balanced stratified cross-validation for accuracy estimation J. Exp. Theor. Artif. Intell. (2000)
- WongT.-T. Performance evaluation of classification algorithms by k-fold and leave-one-out cross validation Pattern Recognit. (2015)
- F. Mohammed, A. Idries, N. Mohamed, J. Al-Jaroodi, I. Jawhar, UAVs for smart cities: Opportunities and challenges, in:...KlemasV.V. Coastal and environmental remote sensing from unmanned aerial vehicles: An overview J. Coast. Res. (2018)
- ErdeljM. et al. Help from the Sky: Leveraging UAVs for disaster management IEEE Pervasive Comput. (2017)
- HuangY. et al.Development and prospect of unmanned aerial vehicle technologies for agricultural production management Int. J. Agric. Biol. Eng. (2013)
- HamY. et al. Visual monitoring of civil infrastructure systems via camera-equipped Unmanned Aerial Vehicles (UAVs): A review of related works Vis. Eng. (2016)
- CruzH. et al. Efficient forest fire detection index for application in unmanned aerial systems (UASs) Sensors (2016)
- ShiX. et al. Anti-drone system with multiple surveillance technologies: Architecture, implementation, and challenges IEEE Commun. Mag.(2018)
- S.R. Ganti, Y. Kim, Implementation of detection and tracking mechanism for small UAS, in: 2016 International Conference...DingG. et al. An amateur drone surveillance system based on the cognitive internet of things IEEE Commun. Mag. (2018)
- Güvençİ. et al. Detection, tracking, and interdiction for amateur drones IEEE Commun. Mag.(2018)
- BirchG.C. et al. UAS detection classification and neutralization: Market survey (2015)
- SturdivantR.L. et al. Systems engineering baseline concept of a multispectral drone detection solution for airports IEEE Access (2017)
- İ. Güvenç, O. Ozdemir, Y. Yapici, H. Mehrpouyan, D. Matolak, Detection, localization, and tracking of unauthorized UAS...BisioI. et al. Blind detection: Advanced techniques for WiFi-based drone surveillance IEEE Trans. Veh. Technol. (2019)
- NguyenP. et al. Cost-effective and passive RF-based drone presence detection and characterization GetMobile: Mobile Comp. Comm. (2018)
- A. Moses, M.J. Rutherford, K.P. Valavanis, Radar-based detection and identification for miniature air vehicles, in:...G.J. Mendis, T. Randeny, J. Wei, A. Madanayake, Deep learning based doppler radar for micro UAS detection and...
- SolomitckiiD. et al. Technologies for efficient amateur drone detection in 5G millimeter-wave cellular infrastructure IEEE Commun. Mag. (2018)
- M. Saqib, S.D. Khan, N. Sharma, M. Blumenstein, A study on detecting drones using deep convolutional neural networks,...UnluE. et al.Using shape descriptors for UAV detection Electron. Imaging (2018)
- WuM. et al. Real-time drone detection using deep learning approach
- BernardiniA. et al. Drone detection by acoustic signature identification Electron. Imaging (2017)
- M. Nijim, N. Mantrawadi, Drone classification and identification system by phenome analysis using data mining...
- X. Chang, C. Yang, J. Wu, X. Shi, Z. Shi, A Surveillance System for Drone Localization and Tracking Using Acoustic...
- J. Busset, F. Perrodin, P. Wellig, B. Ott, K. Heutschi, T. Rühl, T. Nussbaumer, Detection and tracking of drones using...
- C. Yang, Z. Wu, X. Chang, X. Shi, J. Wo, Z. Shi, DOA Estimation Using Amateur Drones Harmonic Acoustic Signals, in:...
- J. Mezei, A. Molnár, Drone sound detection by correlation, in: 2016 IEEE 11th International Symposium on Applied...
- J. Mezei, V. Fiaska, A. Molnár, Drone sound detection, in: 2015 16th IEEE International Symposium on Computational...
Cited by (167)

Mohammad Fathi Al-Sa’d received his B.Sc. and M.Sc. degrees in Electrical Engineering from Qatar University, Qatar, in 2012 and 2016 respectively. He specialized in signal processing and graduated with honors under professor Boualem Boashash supervision. He worked as a Research Assistant at Qatar University, and currently he is a Researcher and a Doctoral student at Laboratory of Signal Processing, Tampere University of Technology, Finland. He has served as a technical reviewer for several journals, including Biomedical Signal Processing and Control, and IEEE Access. His research interests include EEG analysis and processing, time–frequency array processing, information flow and theory, modeling, optimization and machine learning.

Abdullah Al-Ali obtained his master’s degree in software design engineering and Ph.D. degree in Computer Engineering from Northeastern University in Boston, MA, USA in 2008 and 2014, respectively. He is an active researcher in Cognitive Radios for smart cities and vehicular ad-hoc networks (VANETs). He has published several peer-reviewed papers in journals and conferences. Dr. Abdulla is currently head of the Technology Innovation and Engineering Education (TIEE) at the College of Engineering in Qatar University.

Amr Mohamed received his M.S. and Ph.D. in electrical and computer engineering from the University of British Columbia, Vancouver, Canada, in 2001, and 2006 respectively. His research interests include wireless networking, edge computing, and security for IoT applications. Dr. Amr Mohamed has co-authored over 160 refereed journal and conference papers, patents, textbook, and book chapters in reputed international journals, and conferences. He is serving as a technical editor in two international journals and has been part of the organizing committee of many international conferences as a symposia co-chair e.g. IEEE Globecom’16.

Tamer Khattab received the B.Sc. and M.Sc. degrees from Cairo University, Giza, Egypt, and the Ph.D. degree from The University of British Columbia, Vancouver, BC, Canada, in 2007. From 1994 to 1999, he was with IBM wtc, Giza, Egypt. From 2000 to 2003, he was with Nokia Networks, Burnaby, BC, Canada. He joined Qatar University in 2007, where he is currently an Associate Professor of Electrical Engineering. He is also a senior member of the technical staff with Qatar Mobility Innovation Center. His research interests cover physical layer security techniques, information theoretic aspects of communication systems, and radar and RF sensing techniques.

Aiman Erbad is an Associate Professor at the Computer Science and Engineering (CSE) Department and the Director of Research Planning and Development at Qatar University. Dr. Erbad obtained a Ph.D. in Computer Science from the University of British Columbia (Canada), and a Master of Computer Science in Embedded Systems and Robotics from the University of Essex (UK). Dr. Erbad received the Platinum award from H.H. The Emir Sheikh Tamim bin Hamad Al Thani at the Education Excellence Day 2013 (Ph.D. category). Dr. Erbad research interests span cloud computing, multimedia systems and networking, and his research is published in reputed international conferences and journals.
- 1
This work was done while Mohammad F. Al-Sa’d was with the Computer Science and Engineering Department, Qatar University, Doha, Qatar.
© 2019 Elsevier B.V. All rights reserved.
DroneRF dataset: A dataset of drones for RF-based detection, classification and identification
Specifications Table
| Subject area | Engineering. |
| More specific subject area | RF communications and Data collection. |
| Type of data | Tables and Figures. |
| How data was acquired | Using two RF Receivers (NI-USRP2943R) in a laboratory setting. |
| Data format | Raw. |
| Experimental factors | To capture the whole 2.4GHz bandwidth, we have used 2 RF receivers. Each RF receiver has a maximum instantaneous bandwidth of 40 MHz, so both receivers must be operating simultaneously to at least capture a technology spectrum such as WiFi (i.e. 80 MHz) where the first receiver captures the lower half of the frequency band, and the second, records the upper half. |
| Experimental features | We systematically collect, analyze, and record raw RF signals of different drones under different flight modes such as: off, on and connected, hovering, flying, and video recording. |
| Data source location | Department of Computer Science and Engineering, College of Engineering, Qatar University, Doha, Qatar. |
| Data accessibility | Al-Sa'd, Mohammad; Allahham, Mhd Saria; Mohamed, Amr; Al-Ali, Abdulla; Khattab, Tamer; Erbad, Aiman (2019), “DroneRF dataset: A dataset of drones for RF-based detection, classification, and identification”, Mendeley Datasets, v1 https://doi.org/10.17632/f4c2b4n755.1 |
| [8] | |
| Related research article | Mohammad F. Al-Sa'd, Abdulla Al-Ali, Amr Mohamed, Tamer Khattab, and Aiman Erbad, “RF-based drone detection and identification using deep learning approaches: an initiative towards a large open source drone database”, Future Generation Computer Systems, 2019. |
The droneRF dataset can be used to develop new techniques for drones' detection and identification, or as a critical building block in a large-scale anti-drone system that includes other functions such as drones' intrusion detection, tracking, jamming, and activity logging.
DroneRF helps in understanding the signatures of different drones operating in different modes (see section 1.6 for details about the drones' flight modes) based on their radio frequency signal characteristics.
DroneRF can inspire new methods for detecting the drones' existence, and possibly identifying the drones' make, type, etc.
1. Data
In this article, we present an RF based dataset of drones functioning in different modes. The dataset consists of recorded segments of RF background activities with no drones, and segments of drones operating in different modes such as: off, on and connected, hovering, flying, and video recording (see Fig. 4, Fig. 5, Fig. 6). The records are 10.25 seconds of RF background activities and approximately 5.25 seconds of RF drone communications for each flight mode. This has produced a drone RF database with over 40 GB of data encompassing various RF signatures. There are in total 227 segments (see Table 1), each segment consists of two equally sized parts with each part containing 1 million samples, making in total 454 record files. The samples in the segments represent the amplitude of the acquired row RF signals in the time domain. The segments in the database [2] are stored as comma-separated values (csv) files, this makes the drone RF database easy to load and interpret on any preferred software. Metadata for each segment in the database is included within its filename. It contains the segment Binary Unique Identifier (BUI) to differentiate between the drone's mode (see Fig. 7), followed by a character to determine if it is the first or second half of the segment, and its segment number. For instance, the third segment of the second half of the RF spectrum with BUI = 11010, Phantom drone with flight mode number 3, will have the following filename: “11010H3.csv”.

Fig. 1. Experimental setup for the RF database development. The Bebop drone is shown on the middle, the NI-USRP RF receivers are shown on the right and are connected to the laptops, shown on the left, via the PCIe connectors.

Fig. 2. NI USRP-2943R RF receiver [4].

Fig. 3. a: Front panel of the LabVIEW program installed on the laptops to capture the drones' RF communication [1]. b: Block diagram of LabVIEW program [1].

Fig. 4. RF activities plots with normalized amplitudes between −1 and 1. (a) shows segment number 13 of the acquired RF background activities, (b) shows segment number 10 of the acquired Phantom drone activity.

Fig. 5. Different snippets of RF activities for different flight modes for the Bebop drone with normalized amplitude between 1 and -1. Each figure shows the segment number 1 of each flight mode.

Fig. 6. Different snippets of RF activities for different flight modes for the AR drone with normalized amplitude between 1 and -1. Each figure shows the segment number 1 of each flight mode.
Table 1. Details of the developed drone RF database showing the number of raw samples and segments for each drone type.
| Drone Type | Segments | Samples | Ratio |
|---|---|---|---|
| Bepop | 84 | ||
| AR | 81 | ||
| Phantom | 21 | ||
| No Drone | 41 |

Fig. 7. Experiments to record drones RF signatures organized in a tree manner consisting of three levels. The horizontal dashed red lines define the levels. BUI is a Binary Unique Identifier for each component to be used in labelling [1].
2. Experimental design, materials, and methods
2.1. Equipment
In our experiment, flight controllers and mobile phones were used to send and receive the RF commands, to and from the drones under analysis to alter their flight mode. Controlling the drones by a mobile phone requires mobile applications that are specifically developed for each drone. “FreeFlight Pro”, “AR.FreeFlight”, and “DJI Go” are free mobile applications developed to control the Bebop, AR, and Phantom drones, respectively. RF commands intercepted by two RF receivers, described in the next section, each receiver communicates with a laptop (CPU Intel Core i5-520M 2.4 GHz, 4 GB RAM, running Windows 7 64-bit) through PCIe cable (see Fig. 1), doing data fetching, processing and storing are performed by programs we designed in LabVIEW Communications System Design Suite [3].
2.2. Sensing and capturing RF signals
RF sensing and capturing process required RF receivers, to intercept the drone communication with its flight controller, connected to laptops that are responsible for fetching, processing and storing the recorded RF signals in the database. The drones that have been used in the experiment operates differently in terms of connectivity, (e.g. Bebop and Phantom use WiFi 2.4 GHz and 5 GHz with different bandwidths). For more details, one can read the full specification in [5], [6], [7]. In this work, it is assumed that all drones use WiFi operated at 2.4 GHz. Hence, there are some minimal assumptions. However, the drone operating frequency can be detected using various methods such as passive frequency scanning.
First, raw RF samples are acquired using two National Instruments USRP-2943 (NI-USRP) software defined radio reconfigurable devices, shown in Fig. 2: NI USRP-2943R RF receiver. Table 2 lists the NI-USRP RF receivers’ specifications. Since each RF receiver has a maximum instantaneous bandwidth of 40 MHz, both receivers must be operated simultaneously to at least capture a technology spectrum such as WiFi (i.e. 80 MHz) where the first receiver captures the lower half of the frequency band, and the second, records the upper half (see Fig. 4). After that, captured RF data is transferred from the NI-USRP receivers to two standard laptops via Peripheral Component Interconnect Express (PCIe) interface kits. Finally, data fetching, processing and storing are performed by programs we designed in LabVIEW Communications System Design Suite. The programs are designed in a standard LabVIEW manner using front panel and block diagram environments. Fig. 3b shows the block diagram that demonstrates all the functions and operations used to fetch process and store the RF data.
Table 2. Specifications of the USRP-2943 40 MHz RF receivers.
| Number of channels | 2 |
| Frequency range | 1.2 GHz–6 GHz |
| Frequency step | <1 KHz |
| Gain range | 0 dB–37.5 dB |
| Maximum instantaneous bandwidth | 40 MHz |
| Maximum I/Q sample rate | 200 MS/s |
| ADC resolution | 14 bits |
As demonstrated in Fig. 3a, by using the front panel, one can alter the captured band; lower half or upper half of the RF spectrum, carrier frequency, IQ rate, number of samples per segment, gain, and activate a specific channel of the NI-USRP receiver. In addition, one can select different flight modes and experiments to build a comprehensive database.
2.3. Experimental setup
The setup is shown in Fig. 1. To conduct any experiment using this setup, one must perform the following tasks carefully and sequentially. If you are recording RF background activities, perform tasks 4–7:
- 1. Turn on the drone under analysis and connect to it using a mobile phone or a flight controller.
2. In case the utility of a mobile phone as a controller, start the mobile application to control the drone and to change its flight mode.
3. Check the drone connectivity and operation by performing simple takeoff, hovering, and landing tests.
4. Turn on the RF receivers to intercept all RF activities and to transfer those to the laptops via the PCIe connectors.
5. Open the LabVIEW programs, installed on the laptops, and select appropriate parameters depending on your experiment and requirements.
6. Start the LabVIEW programs to fetch, process and store RF data segments.
7. Stop the LabVIEW programs when you are done with the experiment.
8. For a different flight mode, go back to step 6, and for different drones go back to step 1.
2.4. Experiments
The RF drone database is populated with the required signatures by conducting experiments organized in a tree manner with three levels as demonstrated in Fig. 7. The first level consists of the following branches to train and assess the drone detection system:
Drones are off; RF background activities are recorded (see Fig. 4a).
Drones are on; drones RF activities are recorded (see Fig. 4b).
The second level includes experiments that are conducted on the three drones under analysis: Bebop, AR, and the Phantom drones, to train and assess the drone identification system. Finally, the third level expands its predecessor by explicitly controlling the flight mode of each drone under analysis to assess the identification system ability in determining the flight mode of intruding drones.
On and connected to the controller (Mode 1, see Fig. 5a).
Hovering automatically with no physical intervention nor control commands from the controller. Hovering altitude is determined by the drone manufacturer (approximately 1 m) (Mode 2, see Fig. 5b).
Flying without video recording. Note that the drone must not hit any obstacles in this experiment to avoid warning signals (Mode 3, see Fig. 5c).
Flying with video recording (Mode 4, see Fig. 5d).
Note that the drone must not hit any obstacles in this experiment to avoid warning signals. The former experiments are conducted by following the steps summarized in the previous section.
2.5. RF database labeling
The BUI is used to label the RF database entries according to the conducted experiment, drone type, and its specific flight mode, see Fig. 7: Experiments to record drones RF signatures organized in a tree manner consisting of three levels. The horizontal dashed red lines define the levels. BUI is a Binary Unique Identifier for each component to be used in labelling. The BUI is comprised of two binary numbers concatenated such that: BUI = [msBUI, lsBUI], msBUI is the most significant part of the BUI representing the experiment and drone type, levels one and two, while lsBUI is the least significant part of the BUI representing the drone flight mode, third level. The BUI length is determined using the total number of experiments , the total number of drones , and the total number of flight modes , as follows:where in this work, and ; therefore, . Extending the developed database using other experiments, drones, or flight modes can be easily done by increasing or , respectively.
2.6. Visualizing the data
To visualize the data, various software can be used. As mentioned before, each flight mode recording is composed of segments, each segment is split into two parts. In order to plot a segment, the two parts should be loaded into the software work-space together (E.g. 11000L_3, 11000H_3). After loading the data, amplitude normalization can be done for a better visualization, and that's by dividing all the samples in the segment by its maximum absolute value to end up with values between 1 and -1. If needed for data analysis, frequency samples can also be calculated using Discrete Fourier transform (DFT) of each recorded segment coming from both receivers [1]. Fig. 4, Fig. 5, Fig. 6 were generated by shifting the samples of one part e.g. 11000L_3 up by adding 1, while shifting the other part down by subtracting 1.


No comments:
Post a Comment